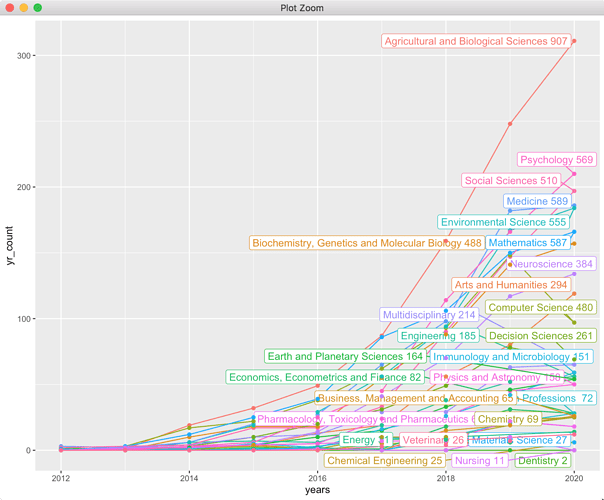
It is grant writing season as well as a bunch of progress reports have been due here at Columbia so I am trying to evaluate Stan’s impact with various online resources. I have basic results for a range of metrics. I’ll start with my favorite because it shows tons of Stan usage in the research literature:
- Counts of research articles mentioning Stan ecosystem packages in Elsevier’s search engine (https://scopus.com).
Annual counts for Stan ecosystem in Scopus.com (Elsevier search engine) classified by Scopus category. Query:’(brms AND burkner) OR (gelman AND hoffman AND stan) OR mc-stan.org OR rstanarm OR pystan OR (rstan AND NOT mit)’ EDIT2: use All Fields option in advanced search.
Comments/questions solicited.
EDIT: The above categories are a subset of what is actually covered–the subset reflects NSF (National Science Foundation) directorates subject areas for a program we are applying for. Below is the graph of all categories.
EDIT2: Corrected graph above, original graph below just to keep the revision clear. Had some odd issues and was wrong but in the end I have verified that API access mirrors the scopus.com counts.
INCORRECT ORIGINAL GRAPH BELOW:
4 Likes
Cool! Can you post plot with cumulative values, too? And the total over all fields?
Total Stan ecosystem counts is 5391 documents.
Sum of all category counts is 10109 category/document pairs, so a journal can apparently have more than one category. Journals are how Scopus classifies.
I’d like to do another round of validation, this seems like high counts.
EDIT2: Above text counts wrong, below counts are wrong, correct counts have been added to first post to prevent someone grabbing them thinking they were correct.
Totals added to labels.
An article should only be counted once as a match for the query.
The classification into Scopus categories is based on the journal the matched article is in and assuming I have not messed up counting then we see that a journal can have more than one category so we get inflation there–so 10109/5391 = 1.87 25116/3678=6.8 (EDIT2) categories per article on average.
None of this has been verified but based on other measures on Google Scholar the 5391 3678 EDIT2 count is not unreasonable. I’ll look at the Scopus docs to confirm that journals can be in multiple categories.
EDIT: Journal’s can definitely be in multiple categories. I drilled down to one journal that was in 6 categories. Also, counts are looking off. Trying to nail down what is going on.
EDIT2: The current graphs/numbers align with the Scopus.com UI. So assuming the query is reasonable I’ll tighten the confidence interval on the results. You will see various EDIT2 changes that go all the way back to the first post.
Thanks for asking questions.
Breck


