Ordered latent probit regression model - fitting issues

I am fitting a model for diagnostic test accuracy data. There are three tests and each can give three outcomes: positive, intermediate result, or negative. The model which assumes conditional dependence between tests works fine. However, when I try to model the dependence by introducting a random effect t into the probit regression model. I get a huge number of divergent transitions (~ 50% of the post-warmup iterations). Was wondering if anybody had any ideas.

Stan and R code below

data {
                int<lower=2> nt; // number of tests
		        int<lower=0> N;	// # of subjects
                int<lower=1> res1[N]; // result of test 1
                int<lower=1> res2[N]; // result of test 2
                int<lower=1> res3[N]; // result of test 3
	}
	parameters {
	      vector[nt]<lower=0> a11_raw;
          vector[nt] a10_raw;
          vector<lower=0.0001>[nt] c11_raw;
          vector<lower=0.0001>[nt] c10_raw;
          vector[nt] b0_raw; 
          vector[nt] b1_raw; 
          vector[N] t; //  subject-specific random effect 
          real<lower=0,upper=1> p; // disease prevalence 
	}

	transformed parameters {
          vector[nt] a11;
          vector[nt] a10;
          vector[nt] c11; // upper threshold for diseased (lower set to 0)
          vector[nt] c10; // upper threshold for non-diseased
          vector[nt] b0;
          vector[nt] b1;
          vector<lower=0,upper=1>[nt] Se; 
          vector<lower=0,upper=1>[nt] Sp; 
          vector<lower=0,upper=1>[nt] int_d; 
          vector<lower=0,upper=1>[nt] int_nd; 
          matrix<lower=0,upper=1>[N,nt]  p1[2,3];

        a11 = 2*a11_raw;
        a10 = 2*a10_raw;
        c11 = 2*c11_raw;
        c10 = 2*c10_raw;
        b0 = 2*b0_raw;
        b1 = 2*b1_raw;
 
          // overall / summary accuracy estimates, for each test
          Se   = 1-Phi_approx( (c11 - a11) ./ sqrt(1 + b1 .* b1) );
          int_d =  Phi_approx( (c11 - a11) ./ sqrt(1 + b1 .* b1) ) - Phi_approx( (- a11) ./ sqrt(1 + b1 .* b1) );  
          int_nd = Phi_approx( (c10 - a10) ./ sqrt(1 + b0 .* b0) ) - Phi_approx( (- a10) ./ sqrt(1 + b0 .* b0) );
          Sp    = Phi_approx( (- a10) ./ sqrt(1 + b0 .* b0) );
         
           
      for (j in 1:nt) {
         for (i in 1:N) { 
        // ordered probit regression model 
        // Non-diseased
        p1[1,1,i,j] =  Phi_approx( - a10[j] - t[i]*b0[j]) ; // prob of testing negative given non-diseased 
        p1[1,2,i,j] =  Phi_approx(c10[j] - a10[j] - t[i]*b0[j]) - Phi_approx(- a10[j] - t[i]*b0[j]) ; // intermedtiate result given non-diseased
        p1[1,3,i,j] =  1-Phi_approx(c10[j] - a10[j] - t[i]*b0[j]) ; // prob of testing positive given non-diseased 
        // diseased
        p1[2,1,i,j] = Phi_approx( - a11[j] - t[i]*b1[j]) ;  
        p1[2,2,i,j] = Phi_approx(c11[j] - a11[j] - t[i]*b1[j] ) - Phi_approx( - a11[j] - t[i]*b1[j])  ;
        p1[2,3,i,j] = 1-Phi_approx(c11[j] - a11[j] - t[i]*b1[j])  ;   
	               }
        }
     }

model {
    a11_raw ~ std_normal(); // ~ normal(0,2);
    a10_raw ~ std_normal(); // normal(0,2);
    c11_raw ~ std_normal(); // ~ normal(0,2);
    c10_raw ~ std_normal(); // normal(0,2);
    b0_raw ~ std_normal(); // ~ normal(0,2);
    b1_raw ~ std_normal(); // normal(0,2);

    t ~ std_normal(); 

  for (i in 1:N) { 
    real lps[2];
 
    // logprob conditinal on non-diseased
    lps[1] = bernoulli_lpmf(0| p)
             + categorical_lpmf(res1[i]| to_vector(p1[1,1:3,i,1]))
             + categorical_lpmf(res2[i]| to_vector(p1[1,1:3,i,2]))
             + categorical_lpmf(res3[i]| to_vector(p1[1,1:3,i,3])) ;

    // logprob conditional on diseased
    lps[2] = bernoulli_lpmf(1| p)
             + categorical_lpmf(res1[i]| to_vector(p1[2,1:3,i,1]))
             + categorical_lpmf(res2[i]| to_vector(p1[2,1:3,i,2]))
             + categorical_lpmf(res3[i]| to_vector(p1[2,1:3,i,3])) ;

    // marginalize
    target += log_sum_exp(lps);
  }
}


R code to run model:

res1 <- c(rep(1, 262), rep(2, 24), rep(3, 26))
res2 <- c(rep(1, 183), rep(2, 61), rep(3, 18), rep(1, 13), rep(2, 5), 
          rep(3, 6), rep(1, 3), rep(2, 4), rep(3, 19))
res3 <- c(rep(1, 181), rep(2, 1), rep(3, 1), rep(1, 56), rep(2, 5),
          rep(1,16), rep(2, 1), rep(3, 1), rep(1, 10), rep(3, 3), 
          rep(1, 5), rep(1, 2), rep(2, 2), rep(3, 2),
          rep(1,1), rep(2, 2), rep(3, 4), rep(2, 1), rep(3, 18))

    model2 <- stan(file = ......, 
                  data = list(res1=res1, res2=res2, res3=res3, N = 312, nt=3), 
                  iter = 3000, 
                  chains = 1, 
                  control=list(adapt_delta=0.80, max_treedepth =10))
1 Like

Sorry, your question fell through a bit. Did you manage to resolve the issue in the meantime? Also, did you check out Divergent transitions - a primer, which has some hints to potentially follow?

Best of luck with your model!

1 Like

Hi, I am using logit links instead now (ordered_logistic_lpmf and bernoulli_logit) and I no longer get any divergences at all. I then multiply by 1.7x to get approximatiion to the probit scale. The results are the same as when I use probit links (and bernoulli_logit(Phi_approx(…)), but I do not get any divergences this way. It is quite strange the divergences dissapear when I switch to logistic distributions.

That would suggest a potential numerical issue. I know Phi_approx() has been found less than great for some extreme values of the input on a few ocasions, I don’t think we got to fixing it yet. Here is how brms implements the cumulative("probit") family. Notably, it uses Phi and not Phi_approx(), so maybe you could try that?

 /* cumulative-probit log-PDF for a single response
   * Args:
   *   y: response category
   *   mu: latent mean parameter
   *   disc: discrimination parameter
   *   thres: ordinal thresholds
   * Returns:
   *   a scalar to be added to the log posterior
   */
   real cumulative_probit_lpmf(int y, real mu, real disc, vector thres) {
     int nthres = num_elements(thres);
     real p;
     if (y == 1) {
       p = Phi(disc * (thres[1] - mu));
     } else if (y == nthres + 1) {
       p = 1 - Phi(disc * (thres[nthres] - mu));
     } else {
       p = Phi(disc * (thres[y] - mu)) -
           Phi(disc * (thres[y - 1] - mu));
     }
     return log(p);
   }

I tried out using Phi on the non-ordered (Bernoulli) component rather than Phi_approx, it took longer and I still get many divergent transitions (several hundred). Interestingly, I have no issues with probit links when I am not estimating the subject-varying effect (i.e setting t[i] = 0 for all i in the model above).

edit: I notice the version above only has ordered components for the regression - the model I am working on now which is very similar uses both standard (bernoulli) and ordered regression. However the issues with probit vs logistic are the same in either case when I have the subject-varying effects there.

And can you check what is the maximum of b0 that gets sampled ? Phi is AFAIK also unstable for some inputs (and we know it is a shame).

Alternatively you could do something like:

if(abs(- a10[j] - t[i]*b0[j]) > 40) {
   print("Extreme");
}

And see if “Extreme” appears in the output.

1 Like

Thanks, I put these if statements in for each of the regression components and I get hundreds of “Extreme” printed out in the output. I have added contraints where I can on the parameters which gets rid of some of the warnings, but I still get many. Is there a way to set contraints on ordered vectors?

Edit: OK, even when i do not get any warnings, i still get many divergent transitions with probit links. Still no divergences with the logit(1.7x) approx

So one thing is that the 40 constant is arbitrary and maybe needs to be lower to ensure stability.

Other thing I find weird is that your code doesn’t seem to ensure the probabilities are all positive - I would expect the c10 and c11 to have lower=0 constraint. In fact most implementations would have the linear predictor without intercept and use ordered[2] for the thresholds…

Also maybe I am missing something and the problem is completely elsewhere…

1 Like

The probabilities are all positive - the lower thresholds are zero. This is based on the random effects model from Qu et al for diagnostic test accuracy and the linear preditor is in the form a + t[n]*b - so no intercept. I am using ordered[2] in my current code:

functions {
  real induced_dirichlet_lpdf(vector c, vector alpha, real phi) {
    int K = num_elements(c) + 1;
    vector[K - 1] sigma = inv_logit(phi - c);
    vector[K] p;
    matrix[K, K] J = rep_matrix(0, K, K);
    
    // Induced ordinal probabilities
    p[1] = 1 - sigma[1];
    for (k in 2:(K - 1))
      p[k] = sigma[k - 1] - sigma[k];
    p[K] = sigma[K - 1];
    
    // Baseline column of Jacobian
    for (k in 1:K) J[k, 1] = 1;
    
    // Diagonal entries of Jacobian
    for (k in 2:K) {
      real rho = sigma[k - 1] * (1 - sigma[k - 1]);
      J[k, k] = - rho;
      J[k - 1, k] = rho;
    }
   
    return   dirichlet_lpdf(p | alpha)
           + log_determinant(J);
  }
}


data {
                int<lower=2> nt; // number of tests
		int<lower=0> NS;	// total # of studies
                int<lower=1> n[NS]; // number of individuals in each study 
                int r[NS,6];
                real y; 
                real x;  
                // indicators for between-study random effects
                real c2r; 
                real c1r; 
                real s1r; 
                real s2r; 
 
	}


transformed data {
                int res1[NS, max(n)] ; // index as res1[s,i]
                int res2[NS, max(n)] ; 
for (s in 1:NS) {
res1[s] = append_array( append_array( append_array( rep_array(1, r[s,1]), rep_array(1, r[s,2]) ) , append_array( rep_array(1, r[s,3]), rep_array(0, r[s,4]) )) , append_array( rep_array(0, r[s,5]), rep_array(0, r[s,6]) ) )   ;
res2[s] = append_array( append_array( append_array( rep_array(1, r[s,1]), rep_array(2, r[s,2]) ) , append_array( rep_array(3, r[s,3]), rep_array(1, r[s,4]) )), append_array( rep_array(2, r[s,5]), rep_array(3, r[s,6]) ) )   ;
    }
}


	parameters {
          real<lower=0,upper=1> p[NS]; 
          vector<lower=-2.5,upper=2.5>[NS] z[8];
          matrix<lower=-2.5,upper=2.5>[max(n), NS] t; 
          matrix<lower=0, upper = 2>[2, 2] b_sd; 
          ordered[2] a1_m_raw;
          vector<lower=-2,upper=2>[2] a2_m_raw;
          matrix<lower=0, upper = 2>[2, 2] a_sd; 
          real<lower=-4,upper=4> b_m01; 
          real<lower=0,upper=4> b_m02; 
          real<lower=-4,upper=4> b_m11; 
          real<lower=0,upper=4> b_m12; 
          ordered[2] c11; 
          ordered[2] c10; 
	}

	transformed parameters {
         ordered[2] a1_m = a1_m_raw + [-1, 1]'; // order the fixed effects to prevent label switch 
          vector[2] a2_m = a2_m_raw + [-1, 1]';
          vector[2] a2[NS]; 
          vector[2] a1[NS]; 
          vector[2] b1[NS]; 
          vector[2] b2[NS]; 

  // between-study model
    for (s in 1:NS) {
    a2[s,1] = a2_m[1]     + c2r*a_sd[1,1]*0.6*z[1,s];    // index Sp 
    a2[s,2] = a2_m[2]     + s2r*a_sd[2,1]*0.6*z[2,s]; 
    a1[s,1] = a1_m[1]     + c1r*a_sd[1,2]*0.6*z[3,s];    // ref Sp
    a1[s,2] = a1_m[2]     + s1r*a_sd[2,2]*0.6*z[4,s]; 
    
    b2[s,1] =  b_m02*cd   + b_sd[1,1]*y*z[5,s];
    b2[s,2] =  b_m12*cd   + b_sd[2,1]*y*z[6,s]; 
    b1[s,1] =  b_m01*cd   + b_sd[1,2]*y*z[7,s]; 
    b1[s,2] =  b_m11*cd   + b_sd[2,2]*y*z[8,s];
                          } 
     }


model {

    c11[1:2] ~ induced_dirichlet(rep_vector(1, 3), 1);
    c10[1:2] ~ induced_dirichlet(rep_vector(1, 3), 1);

for (i in 1:2) { 
 b_sd[,i] ~ std_normal(); 
 a_sd[,i] ~ std_normal();  } 
 a1_m_raw ~ std_normal(); 
 a2_m_raw ~ std_normal(); 

   b_m01 ~ normal(0,x);  
   b_m02 ~ normal(0,x);  
   b_m11 ~ normal(0,x);  
   b_m12 ~ normal(0,x);  

 for (s in 1:NS)     
  z[1:8, s] ~ std_normal();  

 for (s in 1:NS) {
  vector[n[s]] u01 =  Phi_approx(a1[s, 1] + b1[s,1] * t[1:n[s],s]);
  vector[n[s]] u02 =  (a2[s, 1] + b2[s,1] * t[1:n[s],s]);
  vector[n[s]] u11 =  Phi_approx(a1[s, 2] + b1[s,2] * t[1:n[s],s]);
  vector[n[s]] u12 =  (a2[s, 2] + b2[s,2] * t[1:n[s],s]);

  real lp_bern1 = bernoulli_lpmf(0 | p[s]);
  real lp_bern2 = bernoulli_lpmf(1 | p[s]);

  t[1:n[s],s] ~ std_normal(); 

 for (i in 1:n[s]) { 
  real lp1 = lp_bern1
    + bernoulli_lpmf(res1[s,i] | u01[i] ) // 1-Sp
    +   ordered_probit_lpmf(res2[s,i] | u02[i], c10[1:2]  );
  real lp2 = lp_bern2
    +  bernoulli_lpmf(res1[s,i] | u11[i] )// Se
    +    ordered_probit_lpmf(res2[s,i] | u12[i], c11[1:2]  );

    // marginalize
    target += log_sum_exp(lp1, lp2);

if (abs( u01[i]) > 40) {  print("Extreme1"); }
if (abs( u11[i]) > 40) {  print("Extreme2"); }
if (abs( u12[i] - c11[1]) > 40) {  print("Extreme3"); }
if (abs( u12[i] - c11[2]) > 40) {  print("Extreme4"); }
if (abs( u02[i] - c10[1]) > 40) {  print("Extreme5"); }
if (abs( u02[i] - c10[2]) > 40) {  print("Extreme6"); }

   }
 }
}

generated quantities {
        vector<lower=0,upper=1>[nt] Se; 
        vector<lower=0,upper=1>[nt] Sp; 
        vector<lower=0,upper=1>[nt] se[NS]; 
        vector<lower=0,upper=1>[nt] sp[NS]; 
        vector<lower=0,upper=1>[nt] fp[NS]; 
        vector[4] pr[NS]; 
        vector[4] e[NS]; 
        vector[4] o[NS]; 
        vector[4] dv[NS]; 
        vector[4] ot[NS]; 
        real dev[NS]; 
        real  ec[NS]; 
        real  oc[NS]; 
        real  dc[NS]; 
        real num[NS]; 
        real  resdev; 
        vector<lower=-1,upper=1>[NS] corr1; 
        vector<lower=-1,upper=1>[NS] corr2; 

      // overall test accuracy estimates, for each test 
          Se[1] =      Phi_approx( (a1_m[2] )/sqrt(1 + cd*b_m11^2) );
          Sp[1]   =  1-Phi_approx( (a1_m[1] )/sqrt(1 + cd*b_m01^2) );
          Se[2] =   1-   Phi_approx( (a2_m[2] - c11[2] )/sqrt(1 + cd*b_m12^2) );
          Sp[2]   =    Phi_approx( (a2_m[1] - c10[1])/sqrt(1 + cd*b_m02^2) );
       
 for (s in 1:NS) {

        corr1[s] = (b1[s,2]*b2[s,2])/(sqrt(1+ b1[s,2]^2)*sqrt(1+ b2[s,2]^2)); 
        corr2[s] = (b1[s,1]*b2[s,1])/(sqrt(1+ b1[s,1]^2)*sqrt(1+ b2[s,1]^2)); 

        // study-specific estimates 
          se[s,1]   =      Phi_approx( (a1[s,2])/sqrt(1 +b1[s,2]^2) );
          sp[s,1]   =  1 - Phi_approx( (a1[s,1])/sqrt(1 +b1[s,1]^2) );
          se[s,2]   =  1-   Phi_approx( (a2[s,2] - c11[2])/sqrt(1 +b2[s,2]^2) );
          sp[s,2]   =      Phi_approx( (a2[s,1] - c10[1])/sqrt(1 +b2[s,1]^2) );
    
      fp[s] = 1-sp[s];
     // construct expected 2x2 table for each study
    pr[s,1] = p[s] * (se[s,1] * se[s,2]   )         +     (1-p[s]) * (fp[s,1] * fp[s,2]          ) ; // pos on t2
    pr[s,2] = p[s] * (se[s,1]  * (1-se[s,2])  )       +   (1-p[s])* (fp[s,1]  * (1-fp[s,2])      ) ; // neg on t2
    pr[s,3] = p[s] * ((1-se[s,1]) * se[s,2]    )       +  (1-p[s]) * ((1-fp[s,1]) * fp[s,2]      ) ; 
    pr[s,4] = p[s] * ((1-se[s,1]) * (1-se[s,2])   )   +   (1-p[s]) * ((1-fp[s,1]) * (1-fp[s,2])  ) ;

 //    DEVIANCE, CHI-SQUARE, RESIDUALS 
    ot[s,1] = r[s,1];
    ot[s,2] = r[s,3]; 
    ot[s,3] = r[s,4];
    ot[s,4] = r[s,6];

    for (a in 1:4)  {
    num[s] = r[s,1] + r[s,3] + r[s,4] + r[s,6]; 
    e[s,a] = num[s] * pr[s,a] ;                        // expected cell count (2x2 tables so 4)
    o[s,a] = ot[s,a] / num[s] ;                         //# observed prob
    dv[s,a] = 2 * ot[s,a] * log(ot[s,a]/e[s,a]) ;
              }          
    dev[s] = sum(dv[s,]) ;                                        //  # study deviance
  //    r is the observed cell count, o is observed cell count probability 
    
   //  CORRELATION RESIDUALS (Qu et al, 1996)
    ec[s] = (pr[s,1] - (pr[s,1]+pr[s,2]) * (pr[s,1]+pr[s,3]) )/             // expected correlations
    sqrt((pr[s,1]+pr[s,2]) * (pr[s,1]+pr[s,3]) * (1-pr[s,1]-pr[s,2]) * (1-pr[s,1]-pr[s,3]));
    oc[s] = (o[s,1] - (o[s,1]+o[s,2]) * (o[s,1]+o[s,3])) /            // # observed correlations
    sqrt((o[s,1]+o[s,2]) * (o[s,1]+o[s,3]) * (1-o[s,1]-o[s,2]) * (1-o[s,1]-o[s,3]));
    dc[s] = oc[s] - ec[s];                                           //  # correlation residual
   }    
    resdev = sum(dev[]);
}

So just to be clear: the model works as expected if you change Phi_approx(x) to inv_logit(x * 1.7) and ordered_probit_lpmf with ordered_logit_lpmf or are there other adjustments you make?

I’ll admit that I can’t really understand the model in full and it is possible I won’t be able to resolve your issue (though computational problems with Phi are IMHO still the most likely cause). Is it correct that you are mostly OK with the logit version or do you badly need this to work with the probit?

1 Like

That’s right - absultely no divergent transitions with the inv_logit(x * 1.7) and ordered_logit_lpmf. Interestingly the (Phi_approx) probit versions which give divergences run quite a lot faster than the logit, but do seem to get less n_eff’s. I’m fine with the logit versions :)

OK, than I would chalk it up to Phi being ill-behaved. One more thing: you could try with normal_lcdf which got a precision/stability upgrade: https://github.com/stan-dev/math/issues/1284 and lets you work on the log scale directly, so you would have something like (not tested, please double check the math):

 real my_ordered_probit_lpmf(int y, real mu, vector thres) {
     int nthres = num_elements(thres);
     real log_p;
     if (y == 1) {
       log_p = normal_lcdf(thres[1] - mu | 0, 1);
     } else if (y == nthres + 1) {
       log_p = log1m_exp(normal_lcdf(thres[nthres] - mu | 0, 1));
       // Alternatively normal_lccdf(thres[nthres] - mu | 0, 1), but note https://github.com/stan-dev/math/issues/1985
     } else {
       log_p = log_diff_exp(normal_lcdf(thres[y] - mu | 0, 1), 
           normal_lcdf(thres[y - 1] - mu | 0, 1));
     }
     return log_p;
   }
2 Likes

Thanks for the suggestion. That still causes divergences though unfortunately. By the way, the b’s (coefficients for the subject-varying effects) seem to have high autocorrelations and identifibility problems (especially if i don’t force some of them to be > 0 or < 0), so I wonder if it has anything to do with that - this happens regardless of whether using probit or logit. I guess I will just stick to the logit since at least this doesn’t cause any divergences.

Here are some trace plots for some of the (study-specific) b parameters to show what I am talking about:

When 2 out of 4 of the prior means of the b’s are restricted to be > 0:

1 Like

Agree that this looks fishy and that this is probably unrelated to the probit/logit issue. The pairs plot is usually a better visualisation for this type of problem (also see https://mc-stan.org/bayesplot/articles/visual-mcmc-diagnostics.html if you haven’t already)

1 Like

Thanks

It does appear that the posteriors for these parameters (at least for the means, so not on the study-level but the summary ones) always come out looking quite similar to the priors - i.e. they seem to be highly driven by the prior dist and only weakly by the data. Although I am running this just with 5 studies at the moment due to the time it takes to fit these multivariate mixture models, so it could just be due to small number of studies.

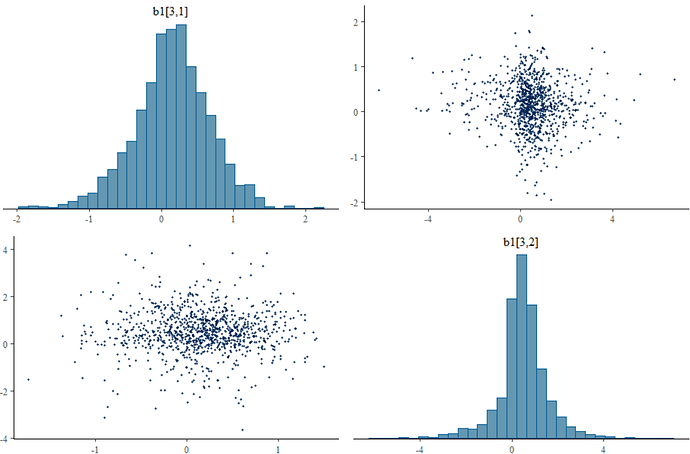
Here is a pairs plot for the mean b parameters with N(0, 1)T(0,) priors

Here is one for some selected study-specific params:

I haven’t used pairs() plot before but looks like there is some colliniarity between some of the study-specific b params?

edit: by the way the b’s (slopes) are partially pooled so thay they can vary for each study. Maybe I need to do this in a different way?

Just to explain the model more. Suppose we S studies, each are evaluating two diagnostic tests and each is dichotomous (positive or negative).

Then, for each subject i \in (1,....,N) from study s \in (1,....,S) , the probability of testing positive ( r_{i} = 1 ) on tests t = 1 or 2 , conditional on disease status d \in {0,1} and latent variable t_{i,s} \sim N(0,1) , is given by

P(r_{i,s,t} = 1 | d, t) = \Phi(a_{t,s,d} + b_{t,s,d}*t_{i,s})

Then, we can assume each a_{t,s,d} and b_{t,s,d} is the same across studies (no pooling) or hierarchical (partial pooling) so that

a_{t,s,d} \sim N(\mu_{a_{t,d}}, \sigma_{a_{t,d}}) and b_{t,s,d} \sim N(\mu_{b_{t,d}}, \sigma_{b_{t,d}}) .

The summary sensitivity and specificity of the two tests is given by:

Se(t) = \Phi (\frac{a_{t,1} } { \sqrt(1 + b_{t,1}^2 )}) , Sp(t) =1 - \Phi (\frac{a_{t,0} } { \sqrt(1 + b_{t,0}^2) })

If we set b_{t,s,d} = 0 \forall t,s,d then we assume conditional independence between the two tests. That is, conditional on disease status d, the result of tests 1 and 2 are independent. The models work fine for this case.

If b_{t,s,d} \neq 0 \forall t,s,d then we implicitly define a multivariate probit model with the variance-covariance matrix for each study, given by I + bb' where b = ( b_{1,s,d}, b_{2,s,d}) , so the variance-covariancematrix between the two tests, conditional on disease d is given by:

\begin{pmatrix} 1+ b_{1,s,d}^2 & b_{1,s,d}*b_{2,s,d} \\ b_{1,s,d}*b_{2,s,d} & 1+ b_{2,s,d}^2 \end{pmatrix}

We can obtain the same matrix with different values e.g. (b_{1,s,d} , b_{2,s,d}) = (1,-1) = (-1,1) . However, even when I put restrictions such as forcing b_{2,s,d} > 0 or ordering them, I have issues with the b’s.

Sorry for the late reply. You are correct that the association between b2[3,1] and b2[1,1] in your plot looks unhealthy (others don’t look immediately problematic to me). I don’t immediately see why.

One potential identifiability/degeneracy problem IMHO is that for any q you can construct b^\prime_{t,s,d} = qb_{t,s,d} and t^\prime_{i,s} = \frac{t_{i,s}}{q} now substituting all b^\prime, t^\prime for b,t gives exactly the same likelihood, so the density differs only in the prior which might not be enough to constrain it usefully.

If I am correct, than pairs plots between (at least a subset of) b and t should show negative correlations in a sort of “banana” shape.

A solution could be to fix one of the b or t to 1 if that makes sense in your case, or constrain the sum of t.

Does that make sense? (It is also possible there are other issues or that I am mistaken, please do check my reasoning).

1 Like

Thanks for the reply! Much appreciated.

I am working on another version of this model by directly defining a multivariate probit - not indirectly via regression. With this version I am not having identifiability problems. This could be because the diagonals of the variance-covariance matrix are fixed to 1 (i.e. correlation matrix), or it could also be because, for the case of 2 tests, it actually requires less parameters to estimate (1 correlation in diseased group, 1 in nondiseased, for each study, whereas the model in this thread needs 2 in each group).

You can see my thread here.

1 Like

How would I go about constraining the sum of a_{t,s,d} + b_{t,s,d}*t_{i,s} t be between say, -10 an 10? is that possible?

This is a math problem (that I am unable to solve in full generality), you get a set of inequalities that you need to solve to get constraints on the individual variables (which you can then use in lower and upper statements)… Additionally, it might happen that you need to somehow reparametrize to make the new variables independent (i.e. with those constraints, large positive elements of a would require large negative elements of b or t)… I currently don’t have a good idea how to solve the problem in this specific instance, unfortunately, because non-linear systems of equations are hard…

1 Like