Modelling a biomarker incorporating donor and time delay effect

Hi Stan community,

I’m a grad student and got a dataset which I would like to model in brms. I’ve read Statistical Rethinking and been following Frank Harell his lessons, but I’m having difficulties to implement this to my own topics. I’m new to all of this and haven’t had formal statistical training, so please bear with me if I ask (too) obvious questions.

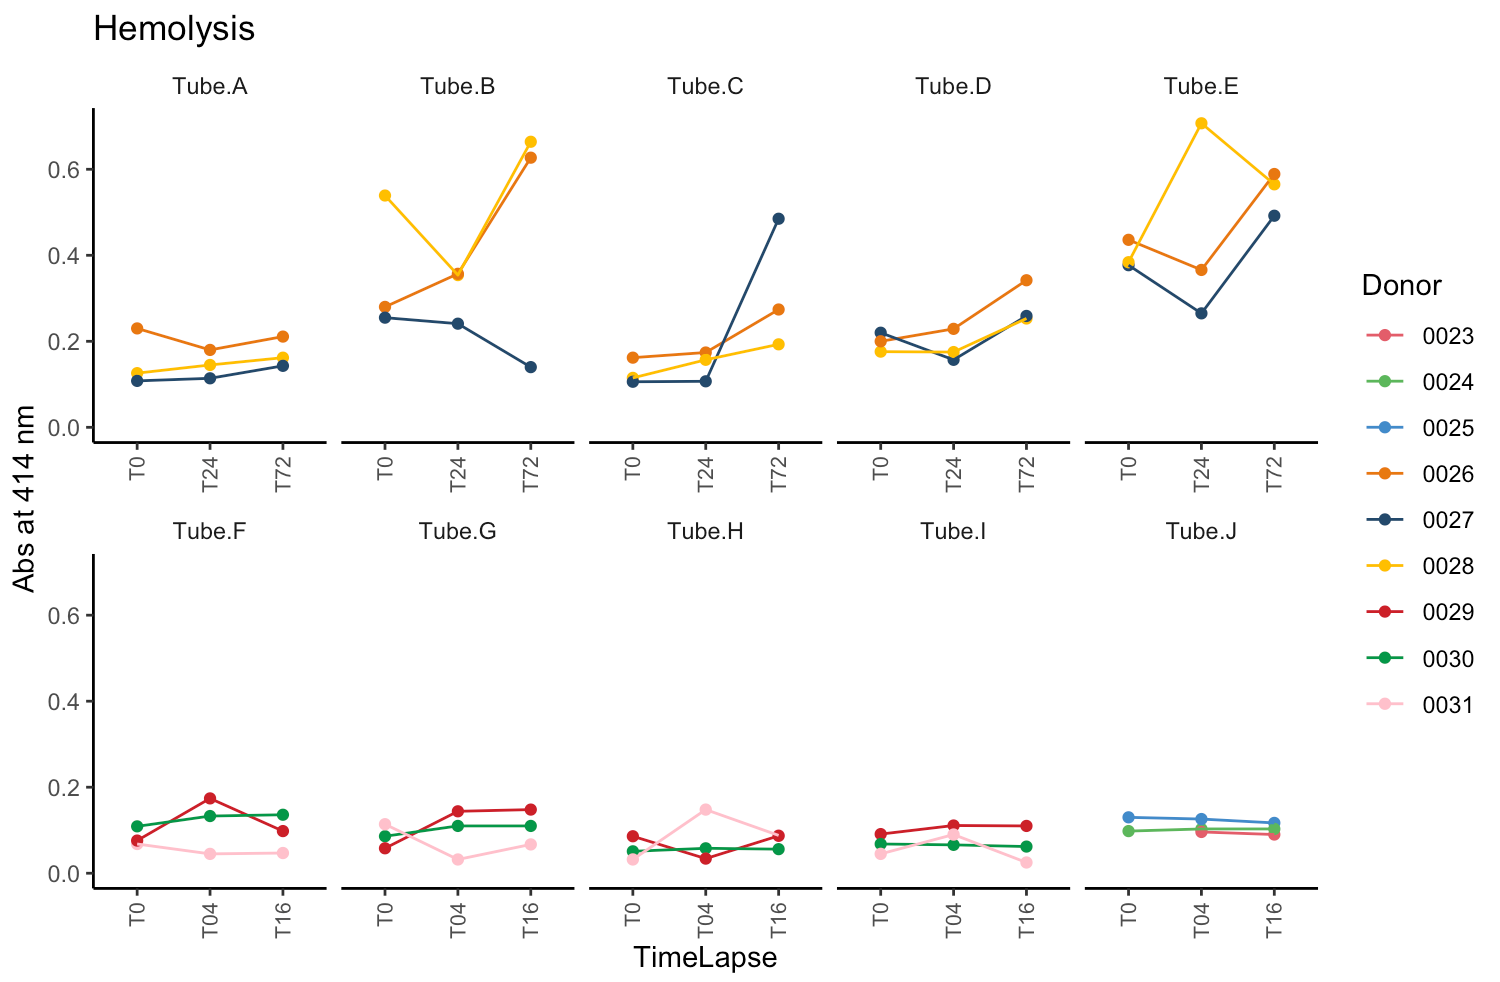
The dataset measured hemolysis in 8 different blood tubes (lets label them A-H), and we want to evaluate which tube has the lowest and highest hemolysis. For tube A-D, we drew blood from 3 volunteers, and for tube F-H, we drew blood in 3 other volunteers. Furthermore, for every tube we have a measurement at timepoint 0 (T0) and later timepoints (T04 for tube A-D, T16 for tube A-D, T24 for tube F-H and T72 for tube F-H).

DAG

The resulting dataset & code looks like this:

require(brms)
require(bayesplot)

tubes <- c("A","A","A","B","B","B")
donors <- c("Donor1","Donor1","Donor1", "Donor1", "Donor1", "Donor1")
hemolysis <- c(0.10,0.34,0.12,0.23,0.45, 0.56)
timepoint <- c("T0", "T04", "T16", "T0", "T04", "T16")

hemolysis_df <- as.data.frame(cbind(tubes, donors, hemolysis,timepoint))

# I tried to specify here a sceptical prior that all tubes suffer from hemolysis based on prior knowledge in literature (value of > 0.5 indicates hemolysis)
prior <- c(prior_string("normal(0.5,0.1)", class = "b")) 

# Sampling from prior, I set the family to lognormal so the results are non-negative 
fit <- brm(formula = hemolysis ~ tube + tube:timepoint  + (1 | donor), data = hemolysis_df, family = lognormal(), chains = 4, cores = 4, iter = 2000, prior = prior, sample_prior = "only")

# Checking output
summary(fit)
plot(fit)

# Sampling
fit_model2 <- update(fit, sample_prior = "no", chains = 4, cores = 4, iter = 2000, control = list(adapt_delta = 0.90, max_treedepth = 13))

# Checking results
summary(fit_model2)
plot(fit_model2)
prior_summary(fit_model2)
marginal_effects(fit_model2)
pp_check(fit_model2)

I found this post ((More) Advice on a Multilevel Time Series Model in BRMS) which looks to have a similar set-up, but if I try to model it like that I"m getting an error “term has fewer unique covariate combinations than specified maximum degrees of freedom”, probably because the dataset is too small.

My questions:

  • Is this dataset even suitable to do statistical modelling (because there are only 3 observations/donor per timepoint + tube combination?
  • How can I incorporate the donor and time effect in the model?
  • Should the timepoints be coded categorical (as factors) or continuous (as numeric)?
  • Is my code decent? Is the prior correctly defined?
  • Is this the right place to ask for help like this, or are there better places?
1 Like

My gut reaction is that you don’t have much data to estimate anything, but it is still possible you could fit something worthwhile if there was prior information (or biological structure) to incorporate somehow. You haven’t explained much of what you are trying to get out of a model, though. It mostly sounds like you could learn everything from simple visualizations of your data points.

You say tubes A-D correspond to Volunteers 1-3, while E-H are Volunteers 4-6. Am I correct in thinking we can simplify this to “2 distinct donor pools, each composed of 3 volunteers”? Are they mixed (i.e., is every tube A-D likely to contain 1/4 of the sample from Volunteer 1)? If so, you cannot really distinguish “donor effects” because Volunteers 1, 2, and 3 are always comingled and measured simultaneously, as are Volunteers 4, 5, and 6. You also seem to have perfect collinearity between measurement times and donor pool, which is why you cannot fit a donor-by-categorical-timepoint interaction model with tube:timepoint.

What was your goal for including a time trend? Do you suspect more or less hemolysis over time? Do you think the different donors will have different rates of hemolysis? The data you have do not support estimation of a complex model, so you need to encode more information somehow.

The prior is not quite right. I think you’ve set the prior on all predictors as normal(0.5, 0.1). I don’t quite remember how the syntax for brms priors works. Typically I specify each predictor as a separate prior.

Thank you for your reply. The raw data plotted looks like this:

, and indeed we can already learn a lot from that (there is a lot of variability in tube B for example compared to the others). Hemolysis is measured by absorbance at 414 nm and the higher the value the more hemolysis. Some studies use an arbitrary cut-off at 0.5 or more, but we don’t want to do that.

This is a pilot study where we tested 8 tubes for hemolysis. We want to select two tubes that we will use in upcoming projects. In frequentist terms, we would look for example for which tube hemolysis was significantly lower compared to the others, and proceed with that tube.

We included a time trend because some tubes show more hemolysis after waiting e.g. 72 hours before processing them. We want to avoid these tubes, we want hemolysis to remain as stable as possible between timepoints, while also being as low as possible. Hemolysis can also vary between donors, depending on how easy the blood draw was (more difficult blood draw in one donor => higher hemolysis in that donor).

We also have several other metrics per tube, I’m using hemolysis as example here.

Aren’t your donors nested within tubes? Also, the time points for tubes A-D are different than F- J. You may want to analyze them seperately?

As a start, I would go with

(1|tube/donor) + time

Edit - although the above specification ignores the fact that tube A through D has the same donors.

According to brms docs, the above becomes (1|tube) + (1|tube:donor).

I would then generate predictions for each tube, but like so

posterior_linpred(mod_object, re_formula = (1|tube), ...).   

This would generate inferences for a NEW donor and also, associated uncertainty. Given the small amount of data, this uncertanity would be quite huge. I would try to use prior knowledge to restrict the outcome space to a credible region.

1 Like

Your plots suggest to me that I misunderstood the problem setup. You have 3 distinct lines for Tube A, each with its own donor label, so there must be some way you are able to get donor-specific measurements for each time point even when they are in the same tube. Is it like Tube Design A, or is there some other way you can distinguish donors within a tube?

From your goal, it seems like the challenge is to identify 2 tubes to move forward with to the next stage. Will these be entirely new tubes with new donors and new incubation times? Or are you actually
choosing one of the 30 (or 10? or 8???) tubes in front of you? Having random intercepts suggests you want to make inferences about what will happen with new tubes and with new donors. Otherwise, it makes more sense to do a fixed effect analysis (which is likely to lead to exactly the same decision as you would get from a simple rule of “pick the 2 lines that start low & stay low for Abs414nm”).

As an aside, you didn’t take measurements beyond T16 for F-J, so you don’t know much about the long-term hemolysis levels for those tube/donor combos. For example, Tube I Donor 29 looks pretty stable through T16, but you would have said the same thing about Tube C Donor 27 up until T24, and that obviously went in a different direction.