Looking for help with mixture model

I’m trying to develop a model that would be used for analyzing fMRI data. However, I’m running into parameter recovery issues. I would greatly appreciate some help or advice.

Background

The overall goal is to explore the how well we can use fMRI to characterize the response of various orientation-selective channels of neurons. It is known that neurons have preferences for visual stimuli shown at particular orientations. Moreover, it is known how their response changes as the contrast of the stimuli change. So, among a number of different possible ways that contrast could affect the response of neurons, we’re trying to recover from fMRI data how their responses almost certainly changed (not at the level of individual neurons, but at least at the level of largish channels or groups of neurons).

Currently

At this point, I have what I thought was an okay model, but even when I use a very restricted form of the model I’m unable to recover the parameters that I used to generate the data.

Each observation, y, is distributed according to

y[v,c,o] ~ normal(mu[c,o], noise_voxel[v] )

where v is a voxel, c is the contrast, and o is the orientation being presented. noise_voxel is voxel-specific noise. μ[c,o] should represent the expected activity of a voxel shown a stimulus of a particular orientation at a given contrast, given a particular distribution of channels within the voxel. mu[c,o] would be distributed as a mixture of normal distributions – one for each K channels – corresponding to the proportion of each channel that is present in a voxel:

mu[c,o] = dot_product(channel_W, channel_resp[1:K,c,o])

such that

channel_resp[c,o,k] ~ normal(channel_mu[c,o,k], noise_channel[c] ).

The error, noise_channel, depends on the level of contrast (same error across all channels). w would be a simplex that is Dirichlet-distributed.

Finally, channel_mu is the expected response of a channel to a given orientation presented at a given contrast:

channel_mu[c,o,k] ~ M[c] * exp(von_mises_lpdf( testedTheta[o] | preferredOri[k], kappa[c] ));

a channel, k’s, response to an orientation, testedTheta[o], is a function of the scaled (by M) density of a von Mises – parameterized by the channel’s preferred orientation, preferredOri, as well as the contrast dependent parameters scale M, and concentration kappa.

I’ve restricted everything the model such that it’s just estimating kappa and channel_resp. However, the posterior of kappa is way off. For example, when I generate data with kappa = 1 (setting all other parameters to be data), the model returns a bi-modal posterior clustering around 0 and 0.2.

If it’s helpful, I’ve attached my attempt at coding this model. There is also an example of data that I’ve generated to test the code, and an R script to grabs the data and runs Stan. In that data (only 1 voxel), the true number of channels is locked to 2, there are 2 levels of contrast, 100 orientations were tested 100 times each, channel weights were set to 0.4 and 0.6, the preferred channel orientations were -pi/2 and pi/2, M was 5, and all noise was 0.1. As in the last paragraph says, the only parameter left to be estimated is kappa, whose true value is 1, but the posteriors cluster around 0 and 0.2.

vtf_restricted_wpm.stan (1.5 KB)

run_help.R (654 Bytes)

stan_data.R (446.8 KB)
Sounds like an interesting problem! I’ll take a swing at it, though let me say right off the bat I’m terribly uninformed about fMRI experiments :D.

The overall goal is to explore the how well we can use fMRI to characterize the response of various orientation-selective channels of neurons

This sounds to me like you want to model the response of some neurons as a function of contrast (which I assume is a real number) and an orientation (which I assume is a real number between zero and pi).

So if I was trying to picture this in my head as a headmap, the response would be the color and contrast and orientation would be the axes?

Does the mixture model come in because you expect the heatmap to have multiple distinct lumps? Is it that different sets of neurons respond at different contrast/orientation locations?

Is that at all close?

edit: bat spelling

Hi guys,

Not sure if this is relevant at all, but just wondering whether the multimodality might be hampering posterior exploration. I don’t know what flavour of HMC is being used here, but there are some that might be able to help further (don’t know if Stan offers them yet):

Lan S., Streets, J., & Shahbaba, B. (2014). Wormhole Hamiltonian Monte Carlo. In Proc. 28th AAAI Conf. on Artificial Intelligence, Quebec City, Canada, 27–31 July 2014, pp. 1953–1959.
http://pubmedcentralcanada.ca/pmcc/articles/PMC4386289/

Lan S., Stathopoulos, V., Shahbaba, B., & Girolami, M. (2015). Markov chain Monte Carlo from Lagrangian dynamics. Journal of Computational and Graphical Statistics, 24, 357–378.

Nishimura, A., & Dunson, D. (Feb. 19 2017). Geometrically Tempered Hamiltonian Monte Carlo (version 2).
arXiv:1604.00872 [stat.CO]

For what it’s worth,

Cam

Thanks for taking an interest! I think what you’ve described is almost the right idea

This sounds to me like you want to model the response of some neurons as a function of contrast (which I assume is a real number)

Contrast could range between [0,1]. But, if we can get this to work, we’d hope to move on to other, less well defined parameters (e.g., attention). It’ll be hard to have more than just a low and high condition, so we were only planning to measure responses to a low and high contrast display (that is maybe not set in stone).

and an orientation (which I assume is a real number between zero and pi).

Yeah, stimuli are only uniquely defined over a range of pi values. But, the von Mises density has a peak every 2pi, so I’ve been working with orientations that vary between -pi to pi. I will need to work with a modified von Mises at some point, such that it has a peak every pi. I opted to allow orientation to range over -pi to pi, assuming that a manually defined function would work a bit slower than the built-in von_mises_lpdf.

Does the mixture model come in because you expect the heatmap to have multiple distinct lumps? Is it that different sets of neurons respond at different contrast/orientation locations?

That’s right. If a stimulus has an orientation of pi/2, the activity we observe is presumably the result of some mixture of a whole bunch of different subpopulations of neurons, each with their own preferred orientation (to which that subpopulation’s response is maximal). Differences in contrast could then be expected to have some combination of a few different effects (e.g., making the lumps more distinct, or acting as a multiplicative gain/scaling factor).

PS
Here’s what I was thinking of doing when working with orientations that varied from 0 to pi:

real dvm2(real x, real theta, real concentration){
  return (exp(concentration * cos(x - theta)^2)) / (2*pi() * modified_bessel_first_kind(0,concentration)); 
}

wondering whether the multimodality might be hampering posterior exploration.

My working-hypothesis is just that I’ve parameterized the model in some faulty way. The model is currently pretty constrained, and I don’t quite understand why this multimodality is appearing. But, if it turns out to be unavoidable I’ll look in to these references. Thanks for them.

Cool beans, that makes sense.

Now more questions! I assume the response is always positive? Is the response a continuous value or is it a count value?

And is the goal of this to model the response of a bunch of neurons to different contrast/orientation combinations?

Or is there something else here you’d like to do inference on? Like, is there a higher level objective? Like maybe you get these orientation/contrast responses for a bunch of different subjects and want to try to explain the differences in the responses as a function of the subject?

We’ll get to conclusions eventually haha. Just gotta understand the data first.

heh, ask away. Sometimes it helps just to come up with answers.

The responses of the neuronal groups are continuous (abstract measure of ‘activation,’ rather than something explicit like spike count). I had actually been coding the response as being positive or negative, but that’s relative to a baseline amount of activity. The response + baseline should always be positive.

Yes, the goal is to model the response of a bunch of groups of neurons to different contrast/orientation combinations, specifically to see whether we can recover how changing contrast is known to change response to given orientations. That is, higher contrast tends to not change either the baseline level of activity of a neuron, nor does higher contrast sharpen a neuron’s response to different orientations (if a neuron responded to a stimulus with low contrast that had an orientation of, say, pi/2 away from the preferred orientation, the neuron still responds to a higher contrast version of that stimulus). Higher levels of contrast seem to just act as a kind of multiplicative gain (higher contrast increases the response to the preferred orientations the most and to less preferred orientations to a lesser extent)

Any higher level objective would just depend on how well this works. Individual differences could be interesting. There are also reasons to think that people have more neurons dedicated to just a few orientations, so this project could be a way to investigate that. But, the current project is really just this kind of parameter recovery endeavor: do we see that higher contrast had a multiplicative effect on subpopulations of neurons, and not some kind of sharpening or baseline increase?

Side note:
I’m writing groups/subpopulations/channels because our data is at the level of ~3mm^3 ‘voxels,’ which presumably contain hundreds of thousands of neurons. So, the groups are, at best, pretty softly defined.

Yeah, maybe the bumpiness is just some kind of specification artifact. In case you do have to live with it, it looks as though Betancourt also has an HMC method for dealing with difficult posteriors. At least this one is within the Stan team and probably ready to roll if you need it:

http://andrewgelman.com/2014/05/20/thermodynamic-monte-carlo/

Not quite ready to roll (we’re missing the last step of how to correct the numerical error in the simulation of the adiabatic trajectories, although there are heuristics that can be used in a pinch), but then neither are any of the others you quoted (wormhole requires knowing where the modes are a priori and then is awkward to implement, Langevin dynamics won’t jump between modes at all, and the GTHMC algorithm is a mess). Algorithms are going to be able to help only so much and it is always better to try to build a better identified model.

One word of caution from the little fMRI work that I’ve done – the voxel intensities are almost always non-Gaussian, especially if you’re anywhere close to the resting baseline. Trying to force a Gaussian likelihood here can cause some serious computational problems.

Michael,
Thanks for the update/clarification. New algorithms seem to be multiplying like rabbits, so sober second thoughts are appreciated. It seems as though DREAM is currently being touted as a good way to handle difficult posteriors too, not sure how it measures up either (http://escholarship.org/uc/item/6j55p5kh#page-1). Certainly agree on prioritizing getting a well-identified model.
Cam

I’m pretty sure there isn’t a “good” (= stable, reliable, robust, flexible) way of handling difficult posteriors yet. Just some methods that are less bad than others :p

1 Like

Differential evolution is no good, either!

The problem is that academia incentivizes new algorithms as they appear the most “novel” contributions, and poor statistics pedagogy leaves many applied scientists confusing modeling with computation and thinking that a new algorithm will solve all of their modeling problems. Further, poor understanding of how to evaluate statistical algorithms makes it hard to identify how poorly most of these algorithms perform even on relatively simple models.

We take a more principled approach and try to identify what properties we need to fit complex problems (for example, what do we need to explore high-dimensional posterior distributions?) and then build algorithms around those properties. That is why we rally behind Hamiltonian Monte Carlo, and the same approach is what motivated Adiabatic Monte Carlo.

So if there’s a new principled algorithm that is proposed that works well on a wide class of problems please be assured that it will quickly make its way into Stan. Until then we (okay, largely I) will probably come across as the persnickety jerk whose always hating on other people’s work. But if that’s the cost for maintaining the robustness of Stan then I’m willing to assume that cost. :-)

Fair enough! :-)
Cam

So the thing I’ve been trying to figure out is if there’s a way to do this modeling without mixtures. A lot of the time they just end up being annoying and hard to fit.

Dunno if it’s possible to avoid here, but here’s my try.

So my understanding is the data is, for each neuron (or 3x3x3 block of neural tissue or whatever), you have measured data which tells you for a high contrast and for a low contrast what response (as an intensity) you get from at a set of orientations.

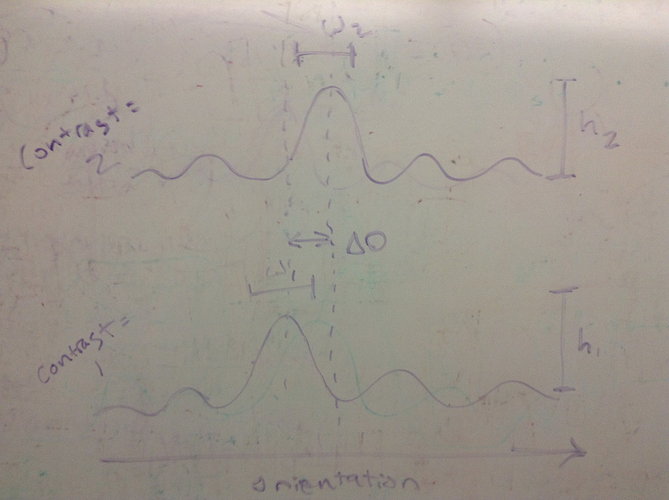
For each neuron, you see a bunch of peaks in this response. You’re curious how these peaks move (change orientation), change maximum intensities, or get wider or thinner.

I made a very high quality diagram of the data + the types of things you want to measure:

From my understanding, the first model is kind of a curve fitting. You fit your intensity as a sum of von_mises, and you want to see how the parameters change as the contrast changes.

Now finally for feedback!

Getting these sorts of curve fitting things to work is hard. The simplest thing that can happen is that the lumps you see in the response vs. orientation curves aren’t really shaped like Von-mises distributions, so when you try to fit a scaled sum of Von-mises distributions the parameters end up in weird places. This can also make your posteriors not super helpful. I definitely see the reason you’d want to measure these things though.

Would it be possible instead to try to take the Stan modeling a level higher? Like, instead of trying to fit these curves explicitly, can you write something to extract features of these curves and then do higher level analysis on them? Like extract the orientation peak, intensity, and some sort of width/curvature estimate?

I’m assuming you have these curves for tons and tons of neurons, and this data is spatially correlated. Then for each neuron what we have is its preferred orientation/intensity/width at low contrast and those same variables at high contrast, so you could check how those things change as you change concentration. Do you have repeated samples from the same neurons? I’m guessing this might be kindof a 1-shot thing, and instead what you have is as assumption that neurons that are near each other act similarly and ones far away might have different responses (there’s things you can do here but I’ll save that for another post).

The downside to this is you’d have to do a bunch of work to characterize the behavior of your feature extractor things (understand how they’re biased, etc.) and you’d probably need to take this into account in the higher level model. But! You’d really need to do this if you’re curve fitting a bunch of Von-mises distributions anyway. This sorta thing isn’t cookie cutter.

Is that at all on track with what you’re doing?

And quick question, I’m assuming you have this data at a few contrasts but a large number of orientations?

And I should add now that I’ve made my super uninformed guess as to what to do – what do other folks do here for there curve fitting? Out of curiosity.

I’m assuming you have these curves for tons and tons of neurons, and this data is spatially correlated.

I’m not sure that I’m following you. The raw data (signal from the voxels) will definitely be spatially correlated. But, there’s not necessarily a reason to assume that the distribution of groups of neurons within a voxel will vary too much from voxel to voxel. Some variability, but at 3mm resolution I don’t think that groups in neighboring voxels will behave more similarly than groups in far away voxels.

Luckily, not just 1-shot. We collect ~400 voxels on a single observation (while one stimulus of a particular orientation/contrast is up). Our assumptions will more be along the lines of that the responses to contrast of the different channels in the different voxels are pretty similar (w1 and w2 in voxel 1 is the same as in the others). Then also, as you said earlier, many orientations, each presented some number of times.

Would it be possible instead to try to take the Stan modeling a level higher? Like, instead of trying to fit these curves explicitly, can you write something to extract features of these curves and then do higher level analysis on them? Like extract the orientation peak, intensity, and some sort of width/curvature estimate?

In a way, that’s all we’re interested in, these higher level descriptions of the different lumps in the curve. The hope was to extract them with the model! But, yeah, I could see applying the model to the output of some features that were extracted. Though, that would be a new analysis to me. Do you have any recommendations of readings/tools?

Thanks,
Patrick

PS
I like the diagram. The only change I’d make is that there’s not necessarily a reason to test whether contrast causes the peaks to shift in their orientation preferences (which I think is your delta-o).

The hope was to extract them with the model!

It’s not a bad idea. If possible, I think (?) it’s better to have a big model where you do all your inferences together (instead of breaking it into pieces), but you have to be careful that all the pieces are being consistent with each other. Maybe what I’m suggesting is to just start small. Break the problem into two pieces for now and do some more investigating before trying to build the big, all-together model.

The thing that scares me here is doing the curve fitting as a sum of scaled von_mises pdfs. That could get really tricky, especially if the intensities aren’t exactly representable as a sum of von_mises pdfs (also there’s the usual parameter mode-swapping non-identifiability that comes up here).

I’d just start extracting peak locations/curvatures/whatevers with a separate script and go from there. The danger is that however you’re doing this extract is super biased and jittery and whatever little set of magic constants you have to put in to get the extraction to work play a huge role in whatever conclusions you get (which is bad, and presumably it’s why you wanted to do the extraction in the model). I think this falls under what Gelman always calls the Garden of Forking Paths on his blog.

Anyway, I don’t think there’s any solution to this other than trying stuff out and looking at data and making plots and talking about results with whoever you’re working on with this haha.

Do you have any recommendations of readings/tools?

I do not :D. You could make another thread and ask about curve fitting stuff and see if anyone knows anything. Maybe post a couple plots of your data (or just do some hand drawings).

As far as curves go, have you read about Gaussian processes? They’re a neat non-parametric thing. First couple chapters in this book http://www.gaussianprocess.org/gpml/chapters/ + the Stan manual are pretty informative on the basics. I dunno where you’d exactly apply them here but they’re probably worth having in mind. There’s also ways you can sample derivatives of your curves if you’re using certain kernels, which might be convenient (it’s all in the GPs book).

We collect ~400 voxels on a single observation

But, there’s not necessarily a reason to assume that the distribution of groups of neurons within a voxel will vary too much from voxel to voxel. Some variability, but at 3mm resolution I don’t think that groups in neighboring voxels will behave more similarly than groups in far away voxels.

Oh, so you’re saying that vaguely you expect all 400 voxels to be iid? And that the voxels are large enough that every voxel responds at multiple orientations (cause each voxel contains a few different channels of neurons)?

Anyway, I don’t think there’s any solution to this other than trying stuff out and looking at data and making plots and talking about results with whoever you’re working on with this haha.

Heh, yeah. We’ve got a couple of participants worth of data to explore potential analysis pipelines before we collect for the main experiment. So, I’ll make my next step exploring those. Thanks also for the link to the book. Glad that there’s still time for summer reading.

Thanks,
Patrick

DREAM isn’t exactly new—it’s a form of differential evolution (and I’m not even sure it satisfies detailed balance given its adaptation). The reason DREAM and other forms of differential evolution won’t scale with dimension is explained here:

http://andrewgelman.com/2017/03/15/ensemble-methods-doomed-fail-high-dimensions/

1 Like