LOO-PIT Plot: How to reduce "hump" at 0.5

I’m working with a data set and fitting a multi-level gaussian model with several (scaled and centered) continuous predictors as well as a categorical predictor and some interaction terms.

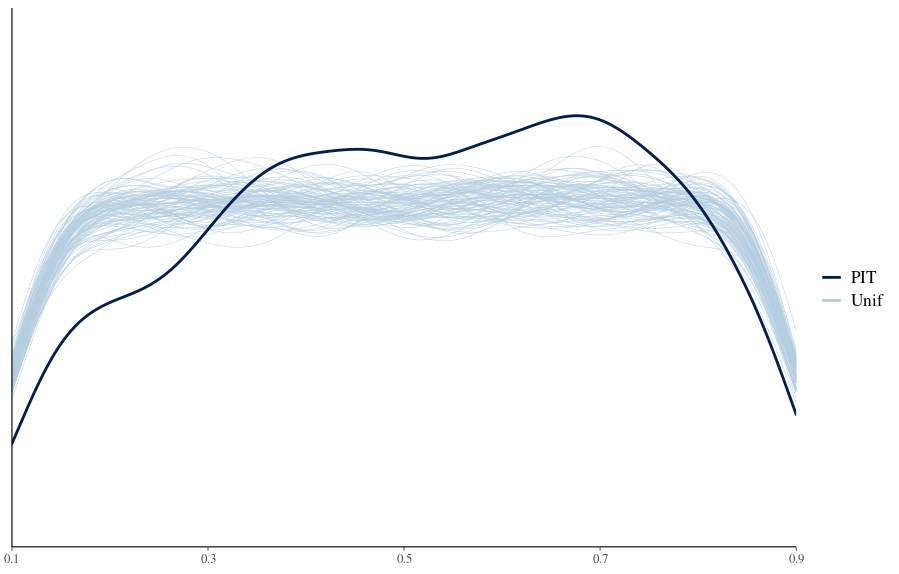
While the posterior predictive checks look somewhat acceptable:

The LOO-PIT plots look poor:

My reading suggests this is likely due to over-dispersion, which in turn could be related to not capturing the uncertainty adequately (model specifies more uncertainty than exists in the data) , both of which mean more modelling is required.

But, I’m unsure of what direction to take?

Is this something I can overcome by revisiting and broadening (or tightening) my SD priors?

I’m running into difficulty imparting any noticeable changes to these plots.

1 Like

That would often be attributable to non-constant error variance across observations. The brms package has a good bit of functionality for “distributional models” that allow you to utilize a GLM for the error variance.

I am using the BRMS package, but because the response/outcome is unbounded and continuous I assumed a distributional model was not the right choice.

Or, are you suggesting a distributional model for the variance within the existing model?

How would I go about implementing that approach?

My BRMS model is:

fmla<- bf(Y ~ pred1.c +
                      pred2.c +
                      pred3 +
                      pred4.c + 
                      pred5 +
                      pred4:pred5 +
                      (1|ID/Side)) +
    lf(sigma ~ 0 + pred3, cmc = TRUE)

I think this models variance for each group in pred3.

I think that is valid syntax, but there is more information in the vignette:

https://cran.r-project.org/web/packages/brms/vignettes/brms_distreg.html

If that is the correct way to approach non-constant variance, am I likely to be able to improve the model through prior tuning?

I don’t think tweaking the prior to obtain a better LOO-PIT is a good idea in the first place. But generalizing the model often is.

Thank you!

I generalized the model somewhat by estimating additional variances for the 2nd categorical predictor and the interaction with the first. This change seems to have improved things!

1 Like