I am writing a paper that involves using projpred for covariate selection for my model, and I am hoping to get some help to get my analyses and their descriptions right.
I was constructing a Poisson BYM2 model for the risk of Salmonella infection at pig-farm level in Spain. I examined some covariates that were related to pig or farm numbers/types. During the variable selection process, the BYM2 component was not included in the model.
Like in the Quick Start vignette of prejpred, I used a regularised horseshoe prior to constructed my reference model, followed by the “cv_varsel” function as in the following code.
cv_varsel(M.pois.hs, method = 'forward', cv_method = 'loo')
The first question is that in the case of loo, how are the variables ranked for the forward process?
Here is how I wrote about the procedure. Could you please have a quick browse and see whether they are correctly done and stated?
The predictive projection technique proposed by (Piironen et al., 2018) was implemented for the covariate selection with ‘projpred’ package (Piironen et al., 2019). The selection process contained two steps. Firstly, a Bayesian penalised regression model with a regularised horseshoe prior and all the covariates was constructed as the reference model that warranted a good prediction ability. Secondly, a forward stepwise addition of covariates that increased the mean log predictive density the most in the leave-one-out cross-validation , starting from the intercept term, was performed. A minimal subset of these covariates in a model which had similar predictive power as the reference model, judged by the mean log predictive density, were to be included in the final model.
The other issue that I’ve encountered is that it seems that my covariates do not predict very well at all. Here is the graph from the following code.
print(varsel_plot(cvs, stats = c('elpd', 'rmse'), deltas = T))
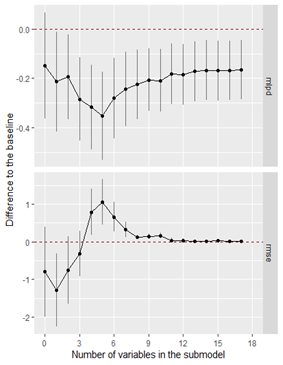
Eventually, I chose the first two covariates to be included in the model as in the regular projection (codes as below), the mlpd and mrse substantially improved after the inclusion of the second covariate.
vs <- varsel(M.pois.hs, method = "L1")
varsel_plot(vs, stats = c('elpd', 'mlpd'), deltas = T)

I wonder what are the comments on this scenario?
Thank you very much!
Cheers
Kendy


