Dear all,
I’m here since I’m still new to stan and still need to familiarize with this powerful tool.
My purpose is to simply fit a light curve (curve specifying the brightness of an object during a certain time) of a star during a microlensing phenomenon (put simply, we should notice an unusual increase in brightness following a specific curve).
In my possession as data elements for stan I have: n measurements of brightness (mags_obs), the error on every measure of brightness (sigma), and the time elapsed (time).
The model I’m using is that every measurement mags_obs[i] should be distributed as N(\mu, \sigma [i]),
where \mu is the theoric value of brightness under the phenomenon of microlensing and \sigma [i] is the error on the measure of mags_obs[i]. The likelihood will thus have the form:
p(\{y_i\} | h) = \prod p( y_i | h) = \prod \frac{e^{\frac{(y_i - h(t))^2}{2\sigma^2}}}{Z}
The theoric value of \mu = \mu(t) is specified via the correct values of the 5 parameters of the model, namely:
h = h(t_0, \, t_e, \, u_0, \, Ibl, f), which are specific to the object causing the microlensing. The relation is shown below inside the function block of the stan file:
functions {
  real mag (data real t, real u0, real t0, real te, real Ibl, real f) {
      real u_t = sqrt(u0^2 + ((t-t0)/te)^2);
      real mu_t = (u_t^2 + 2)/(u_t*sqrt(u_t^2 + 4));
      real Ltot = 10^(-Ibl/2.5); //total luminosity
      real L1 = (1 - f)*Ltot; //lens luminosity
      real L0 = f*Ltot; //stars luminosity
      real L_t = L0*mu_t + L1;

      real m = -2.5*log10(L_t);

  return m;
  }
}

data {
  int<lower=1> n;
  real mags_obs[n];
  real t[n];
  real sigma[n];

}

parameters {
  real t0;
  real te;
  real u0;
  real Ibl;
  real f;
}

model {
  real mu;

  t0 ~ uniform(2450000,2470000);   //priors
  te  ~ uniform(20, 30);
  u0 ~ uniform(0, 1);
  Ibl ~ uniform(10,20);
  f ~ uniform(0, 1);

  for (i in 1:n) {
    mu = mag(t[i], u0, t0, te, Ibl, f);
    mags_obs[i] ~ normal(mu, sigma[i]);   //liklelihood
  }
}
So the problem is that I constatly get warining messages like:
1: There were 2475 divergent transitions after warmup. See
http://mc-stan.org/misc/warnings.html#divergent-transitions-after-warmup
to find out why this is a problem and how to eliminate them.
2: There were 1 chains where the estimated Bayesian Fraction of Missing Information was low. See
http://mc-stan.org/misc/warnings.html#bfmi-low
3: Examine the pairs() plot to diagnose sampling problems
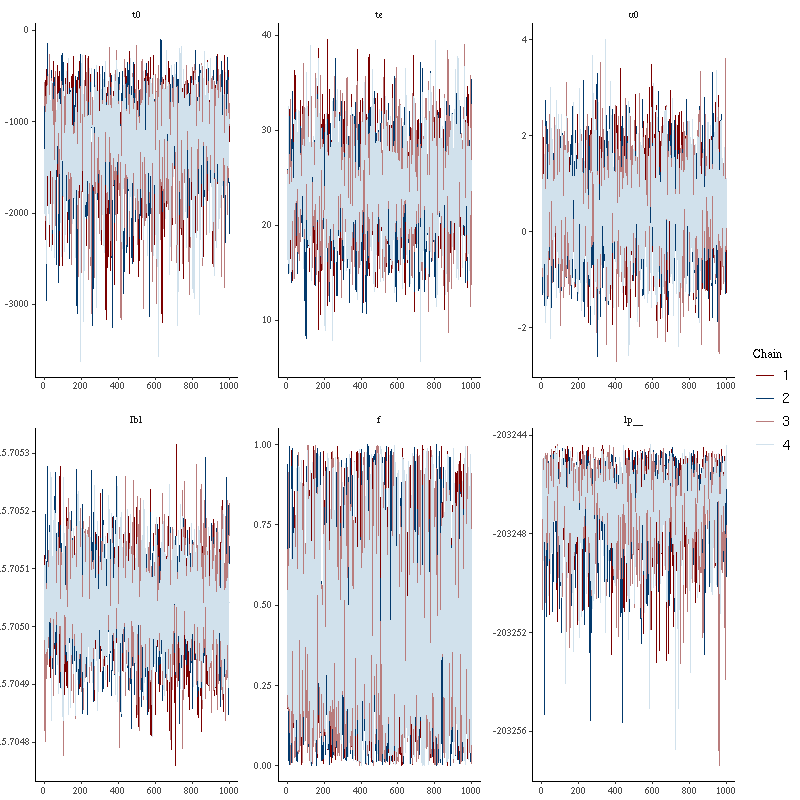
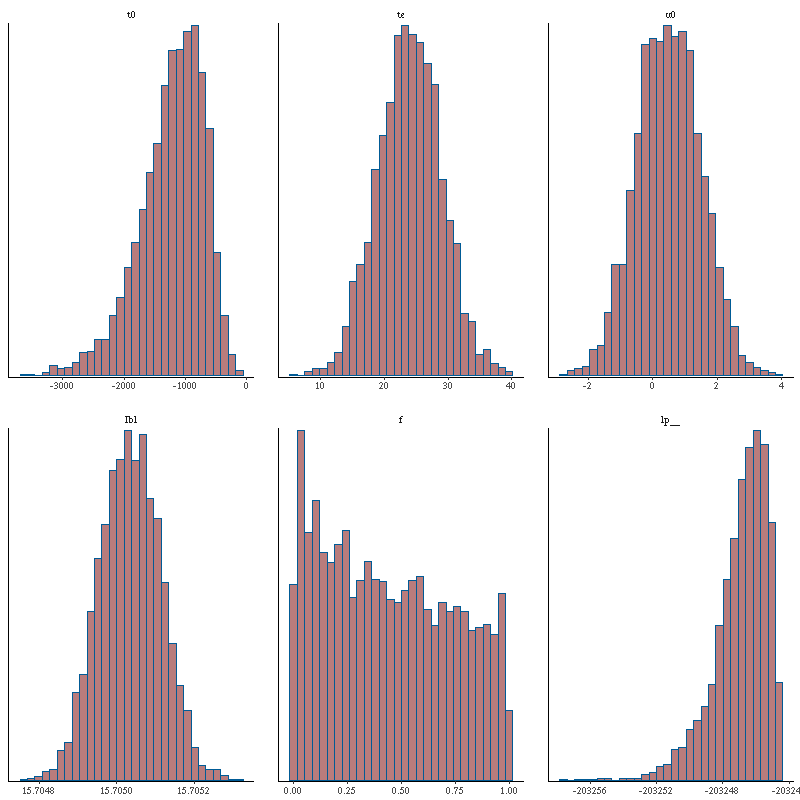
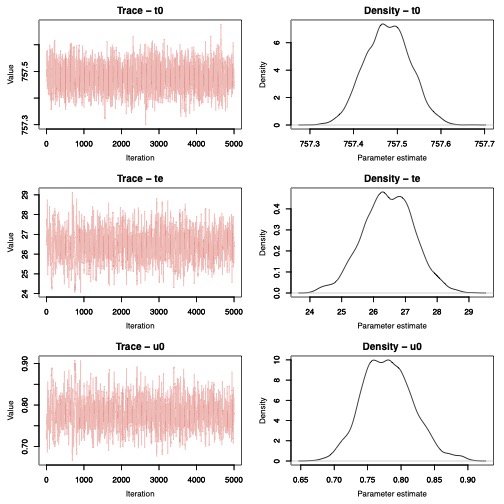
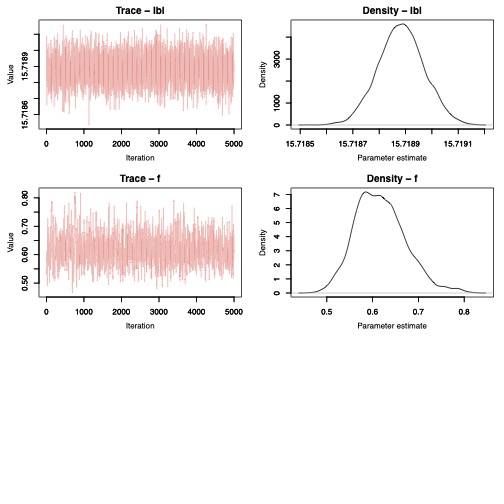
with unreliable means and incorrect predictions of the parameters. For example, these are the diagnostic plot of three of the sought parameters, with iter = 5000 , good starting values and all other options are left by default.
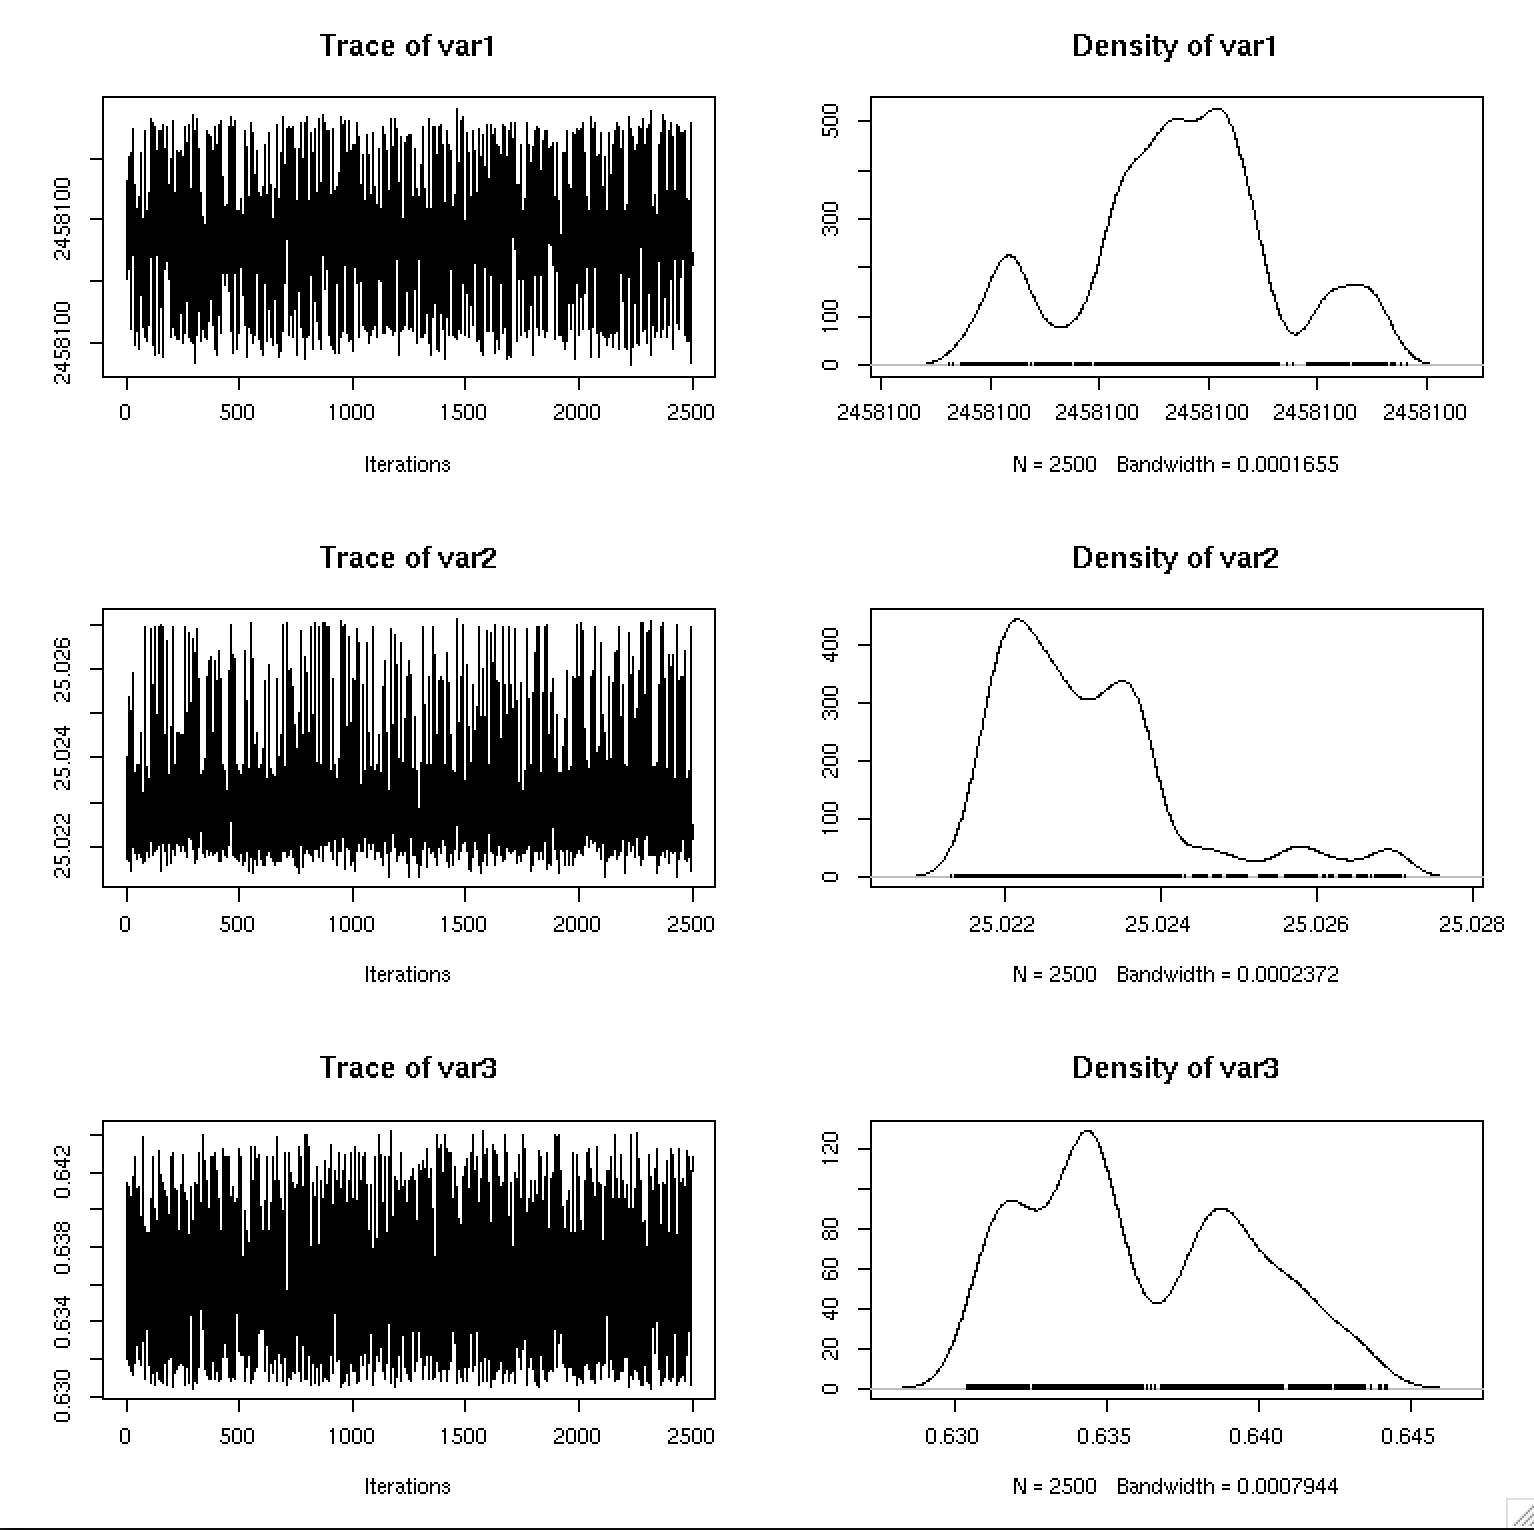
I tried also with a high iteration number and with different adapt_value, but I got the same unsatisfying results nevertheless.
Is there something wrong with my implementation? This is a known phenomenon on which I’ve already worked before, so I’m trying to translate in stan to see the increase in performance.
For clarity I’ll show here an example of a fitted light curve over a set of observations of brightness magnitude:
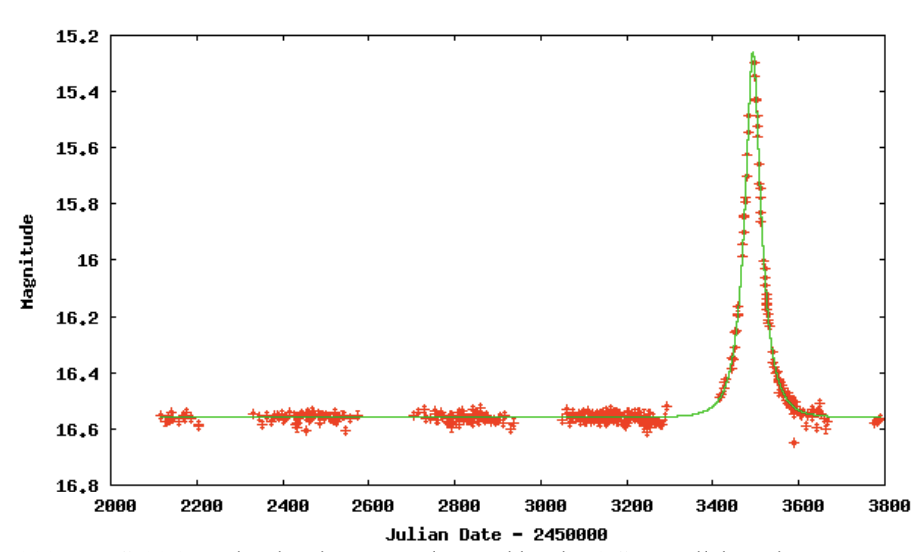
Anyone have a clue on why it behaves like this? Thank you!!