Zero padding in linear convolution results in divergent transitions

I am encountering divergent transitions when fitting a model involving linear convolution. The actual model is very big, so I am providing a snippet code that highlights that main issue.

First, I create a signal vector as follows.

N = 101
x = -floor(N/2):floor(N/2)
signal = 10*exp(-(10*x/N)^2)


Then, using generated quantities in Stan, I perform a linear convolution of the signal with a Gaussian kernel with a scale parameter and a normal observation process with standard deviation sigma. I use the following inputs

dat <- list(N = N,
            signal = signal,
            pseudo_pad = 0,
            sigma = 1.0,
            scale = 2) 

to run the following Stan model:

functions{
  vector normalize(vector x) {
    return x/sum(x);
  }
  
  vector Gaussian_kernel(real scale, int M, int buffer){  
   vector [M] x = linspaced_vector(M, -buffer, buffer);
   vector [M] kernel = inv(scale*sqrt(pi())).*exp(-pow(abs(x/scale), 2));
   return normalize(kernel);
 }
 
  vector conv1D(vector x, vector y){
   return abs(inv_fft(fft(x).*fft(y)));
  }

  vector pad(vector x, int n, int pseudo_pad){
    return pseudo_pad == 1 ? append_row(x, zeros_vector(n) + 1e-15): append_row(x, zeros_vector(n));
  }

  vector linear_convolution(vector signal, vector kernel, int N, int M, int buffer, int pseudo_pad){
    vector[N + M - 1] signal_pad = pad(signal, M-1, pseudo_pad);
    vector[N + M - 1] kernel_pad = pad(kernel, N-1, pseudo_pad);
    
    vector[N] convolution = segment(conv1D(signal_pad, kernel_pad), buffer+1, N);
    return convolution;
  }
}

data {
  int N;
  int pseudo_pad;
  vector[N] signal;
  real sigma;
  real scale;
}

transformed data{
  int M = 2 * (N %/% 2) + 1; // this ensures that M is always odd
  int buffer = M %/% 2;
}

generated quantities{
  vector [N] kernel = Gaussian_kernel(scale, M, buffer);
  vector [N] linear_convolution_generated =  to_vector(normal_rng(linear_convolution(signal, kernel, N, M, buffer, pseudo_pad), sigma));
}

One thing to note about this code is that I use a variable ‘pseudo_pad’ to decide if I want to add 1e-15 to the zeros_vector(n) when padding signal and kernel vectors. Theoretically, ‘pseudo_pad’ should not have any quantitative effect because compared to the non-padded signal and kernal values 1e-15 is approximately zero.

Then I use the following stan model to recover the parameters scale and sigma:


functions{
  vector normalize(vector x) {
    return x/sum(x);
  }
  
  vector Gaussian_kernel(real scale, int M, int buffer){  
   vector [M] x = linspaced_vector(M, -buffer, buffer);
   vector [M] kernel = inv(scale*sqrt(pi())).*exp(-pow(abs(x/scale), 2));
   return normalize(kernel);
 }
 
  vector conv1D(vector x, vector y){
   return abs(inv_fft(fft(x).*fft(y)));
  }

  vector pad(vector x, int n, int pseudo_pad){
    return pseudo_pad == 1 ? append_row(x, zeros_vector(n) + 1e-15): append_row(x, zeros_vector(n));
  }

  vector linear_convolution(vector signal, vector kernel, int N, int M, int buffer, int pseudo_pad){
    vector[N + M - 1] signal_pad = pad(signal, M-1, pseudo_pad);
    vector[N + M - 1] kernel_pad = pad(kernel, N-1, pseudo_pad);
    
    vector[N] convolution = segment(conv1D(signal_pad, kernel_pad), buffer+1, N);
    return convolution;
  }
}

data {
  int N;
  int pseudo_pad;
  vector[N] signal;
  vector[N] convolution_generated;
}

transformed data{
  int M = 2 * (N %/% 2) + 1; // this ensures that M is always odd
  int buffer = M %/% 2;
}

parameters{
  real <lower = 0> scale;
  real <lower = 0> sigma;
}

transformed parameters{
  vector [N] kernel = Gaussian_kernel(scale, M, buffer);
}

model{
  convolution_generated ~ normal(linear_convolution(signal, kernel, N, M, buffer, pseudo_pad), sigma);
  [sigma, scale] ~ exponential(1);
}

with the following input values:

dat <- list(N = N,
            signal = signal,
            pseudo_pad = pseudo_pad,
            convolution_generated = convolution_generated) 

The convolution_generated is the output of the generated quantities.

The problem is when I use pseudo_pad = 0, I get divergent transitions:

All 4 chains finished successfully.
Mean chain execution time: 124.1 seconds.
Total execution time: 163.7 seconds.

Warning: 909 of 1600 (57.0%) transitions ended with a divergence.
See https://mc-stan.org/misc/warnings for details.

Warning: 691 of 1600 (43.0%) transitions hit the maximum treedepth limit of 10.
See https://mc-stan.org/misc/warnings for details.

# A tibble: 2 × 10
  variable  mean median    sd   mad    q5   q95  rhat ess_bulk ess_tail
  <chr>    <dbl>  <dbl> <dbl> <dbl> <dbl> <dbl> <dbl>    <dbl>    <dbl>
1 scale     1.37   1.15 0.897 0.879 0.434  2.72   Inf     4.08       NA
2 sigma     1.02   1.12 0.285 0.133 0.543  1.30   Inf     4.08       NA

But when I use pseudo_pad = 1, the fitting goes well.

All 4 chains finished successfully.
Mean chain execution time: 3.2 seconds.
Total execution time: 3.7 seconds.

# A tibble: 2 × 10
  variable  mean median     sd    mad    q5   q95  rhat ess_bulk ess_tail
  <chr>    <dbl>  <dbl>  <dbl>  <dbl> <dbl> <dbl> <dbl>    <dbl>    <dbl>
1 scale     2.20   2.20 1.45   1.83   0.102  4.59  1.01     291.     439.
2 sigma     1.02   1.02 0.0709 0.0678 0.912  1.14  1.01     393.     386.

I was wondering if someone could explain why zero padding is leading to divergent transitions.

Thank you in advance
I wish I understood FFTs better!

First, I’d suggest you change the pad function to this:

vector pad(vector x, int n, real epsilon) {
   return append_row(x, rep_vector(epsilon, n));
}

Then if epsilon = 0, you get 0 padding and if epsilon = 1e-15 you get epsilon padding.

But this isn’t the source of your problem. To get at that, I’d try to instrument the code with print statements to see where things diverge. You can look at the output of each operation by using Stan’s print statement. Then you can see where things go wonky, like producing NaN or infinite values.

There’s a big difference between any zero and non-zero value. For example, dividing by zero is going to produce an infinite value, whereas dividing by 1e-15 will produce a finite value unless you start with something really really big. But I would think if this is all going through an FFT, the padding could be zero.

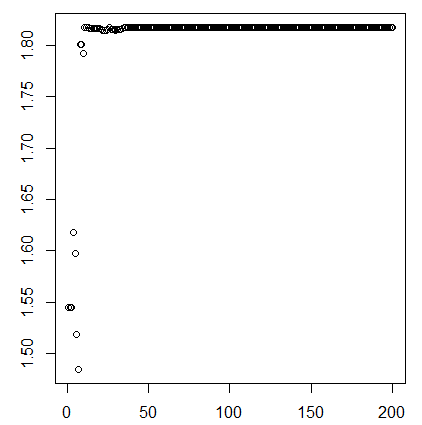
Hi Bob, thanks for your help with this issue. I’m Nikunj’s colleague and have been puzzling over the same code. I’m not sure what is most useful for diagnosing so I wanted to share some of my steps so far. With Nikunj’s zero-padded code, I reproduce his results–large numbers of divergent transitions and treedepth limits being hit. The direct cause of this seems to be that it learns a vanishingly small step-size in the warmup period (~1.05e-14). You can see this happen very quickly in watching the values of the scale parameter during warmup basically choke up after moving around a bit.

image

In contrast, the zero-padded code navigates a variety of parameter values during the warmup period as one would expect

image

Out of curiosity, I tweaked the adapt_delta value of the zero-padded code, thinking this might avert the vanishing step size issue. Indeed, setting it to 0.5 gets rid of all the treedepth limit warnings, and even drops the divergent transitions (a bit) to 51%. And the posterior actually starts to look pretty similar to the pseudo-zero-padded case.

Zero-padding (adapt_delta=0.5):

# A tibble: 2 × 10
  variable  mean median     sd    mad    q5   q95  rhat ess_bulk ess_tail
  <chr>    <num>  <num>  <num>  <num> <num> <num> <num>    <num>    <num>
1 scale     1.99   1.65 1.40   1.60   0.228  4.31 1.01      65.2     87.3
2 sigma     1.03   1.02 0.0768 0.0657 0.907  1.17 0.999    142.      73.0

Pseudo-padding:

# A tibble: 2 × 10
  variable  mean median     sd    mad    q5   q95  rhat ess_bulk ess_tail
  <chr>    <num>  <num>  <num>  <num> <num> <num> <num>    <num>    <num>
1 scale     2.27   2.22 1.56   1.93   0.158  4.70  1.00    137.     144. 
2 sigma     1.03   1.03 0.0741 0.0701 0.909  1.16  1.01     93.1     90.5

In either case, the parameter is only weakly identifiable given the amount of synthetic data. I then tried following your suggestion to Nikunj, but I could not discover NaNs or infinite values. First I just used cmdstanrs diagnostic draw to query gradients at some arbitrary parameter values, but they were always extremely similar between the true and pseudo zero padding methods. For one example, I got:

Zero-padding:

  param_idx    value      model finite_diff       error
1         0 0.466247   0.388003    0.388003 3.58312e-09
2         1 0.236028 -34.652000  -34.652000 1.42963e-09

Pseudo-padding

  param_idx    value      model finite_diff        error
1         0 0.466247   0.388003    0.388003 -1.06277e-08
2         1 0.236028 -34.652000  -34.652000  1.42969e-09

I plugged in some arbitrary random values as well as some values where the chains had previously gotten stuck. I certainly could be missing some points, but for all the values I tried I didn’t see any notable difference between the auto-diffed gradients of the two models.

I then stuck in some print statements of the target density through basically every line of the model statement. I didn’t find any extreme values although it does do the strange thing of eventually crashing the chains. For example, this excerpt does not show all the print statements, just the last few:

Chain 1 log density before = -2.08868 
Chain 1 log density after observation =-56.4774 
Chain 1 log density after sigma prior =-57.6817 
Chain 1 log density after scale =-57.6817 
Chain 1 log density before = 0.807471 
Chain 1 log density after observation =-51.9553 
Chain 1 log density after sigma prior =-55.2186 
Chain 1 log density after scale =-55.2186 
Chain 1 log density before = 2.16025 
Chain 1 log density after observation =-63.7768 
Chain 1 log density after sigma prior =-73.4974 
Chain 1 log density after scale =-73.4974 
Warning: Chain 1 finished unexpectedly!

I thought maybe I could track something down in the cause of the chain crashing, but the same thing eventually happens with the pseudo-padded code when I include the print statements:

Chain 1 log density after observation =-50.2239 
Chain 1 log density after sigma prior =-55.1943 
Chain 1 log density after scale =-55.1943 
Chain 1 log density before = 1.39974 
Chain 1 log density after observation =-50.1615 
Chain 1 log density after sigma prior =-55.0277 
Chain 1 log density after scale =-55.0277 
Chain 1 log density before = 1.18602 
Chain 1 log density after observation =-50.7041 
Chain 1 log density after sigma prior =-54.8691 
Chain 1 log density after scale =-54.8691 
Chain 1 log density before = 1.06533 
Chain 1 log density after observation =-51.0184 
Chain 1 log density after sigma prior =-54.8591 
Chain 1 log density after scale =-54.8591 
Warning: Chain 1 finished unexpectedly!

So I’m not sure if the chain crashing is indicative of anything or if it’s just some quirk of my cmdstanr setup.

I also put print statements in the 1) scale and 2) sigma parameters, as well as the 3) unpadded convolution kernel, the values of which depend on the scale parameter. I can paste those in here too, but I didn’t see any NaN or infinity values anywhere, or really anything that struck me as off. Where would you suggest going with the diagnostics? Anything obvious I am missing in terms of the print-statement diagnostics? Or other angles?