foo_model <- "
data{
  int<lower=0> Nsites;
  int<lower=0> N;
  real<lower=0> y[N];
  int site[N];
  int month[N];
  int day[N];
}
parameters{
  real betaINT[Nsites];
  matrix[Nsites,12] betaSITEMTH;
  matrix[Nsites,366] betaSITEDAY;
  real<lower=0> varcomp1[Nsites];
  real<lower=0> varcomp2[Nsites];
  real<lower=0> varcomp3[Nsites];
  real<lower=0> int_sd;
  real int_mu;
}
transformed parameters{
     real mu[N];
     for (i in 1:N)
      mu[i] = int_mu + int_sd*betaINT[site[i]] +
                       betaSITEDAY[site[i],day[i]]*varcomp1[site[i]] +
                       betaSITEMTH[site[i],month[i]]*varcomp2[site[i]];
  }
model{
  varcomp1 ~ normal(0,1);
  varcomp2 ~ normal(0,1);
  varcomp3 ~ normal(0,1);
  int_mu ~ normal(0,1);
  int_sd ~ normal(0,1);
  betaINT ~ normal(0,1);
  to_vector(betaSITEMTH) ~ normal(0,1);
  to_vector(betaSITEDAY) ~ normal(0,1);
  for (i in 1:N)
   y[i] ~ normal(mu[i], varcomp3[site[i]]) T[0,];
}
"
I can fit the above model with the ‘betaSITEDAY’ term in mu commented out, or, with the betaSITEDAY term but without the truncation and lower bound on y. However, if the model is fitted as shown above, stepsize__ goes very small, e.g. 1E-9, and the chains effectively get stuck within about 30 iterations.
I have tried changing initials and increasing adapt_delta = 0.9999 and max_treedepth = 15. The latter changes might work - but they slow everything down far too much to be practical because I’m hitting the max_treedepth.
Is there something obvious that I’m missing? The only additional solution that I could think of was to turn off adaptation and fix the stepsize to something from before it goes small, but this seems like a bad idea… I’m on RStan 2.16.2 in R 3.4.2. Data are available here.
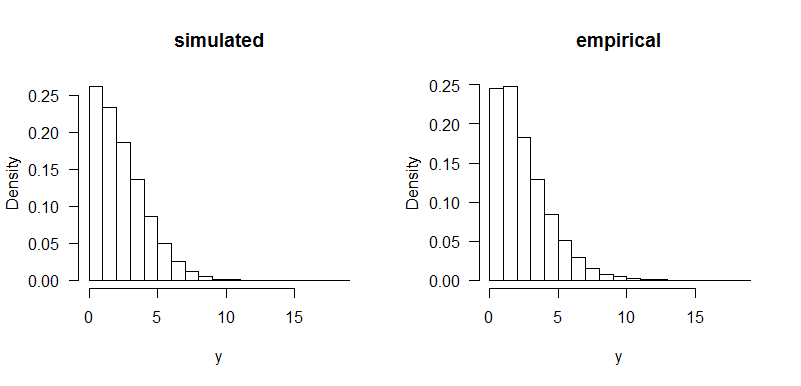
For completeness, I think this has to do with a peculiarity of my data. The model fits if I simulate data from a “true” truncated normal using something like:
library(msm)
N <- 87000
y <- rtnorm(N,0,3,lower=0)
site <- sample(1:18,N,replace=T)
month <- sample(1:12,N,replace=T)
day <- sample(1:366,N,replace=T)
foo_data <- list(Nsites = 18, y = y, month = month, day = day, N = N, site = site)
But the simulated distribution has more mass near zero than my data if you compare histograms:
I can’t for the empirical data as the chains don’t move and get fixed very quickly, but I have done so for the simulations. Nothing looks out of the ordinary. For example, below is a plot for the betaSITEDAY[,1] in each site against the respective varcomp parameter.
You just have a lot of parameters that enter the likelihood as products so either for sites with little data or sites with a lot of data you might have dependence problems. It might not be well identified for int_sd and the varcomp either since for a single site you could scale all the parameters and get the same answer.
Thanks Krzysztof. Unfortunately I don’t think it’s that straightforward. The data are reasonably balanced. From the file available in my original post:
You find similarly decent balance if you look at sites-by-month or day. Plus, wouldn’t the issue you describe result in poor estimates for just some parameters rather than the chains effectively getting stuck for all parameters?
Unless I’m missing something obvious, I really think there is something more complicated going on here…
When you say chains get stuck you probably mean that the stepsize crashes to something like 1e-6 or lower. That happens due to divergences or to low acceptance rates. Both are problems related to posterior geometry so that answer is something like what I described. HMC as implemented with Stan will work fine with pretty wacky posteriors so if it’s failing to adapt that’s a great clue that you have bigger problems with your model.
¯\_(ツ)_/¯
I just mentioned a couple of possibilities but you have to actually go looking to find the culprit.
…
Also your int_mu and betaINT are additively non-identified.
Yes, as I said in my original post stepsize goes much smaller than 1e-6, resulting in the chains getting stuck. And it does so when there are actually no divergences and the acceptance rates are high - partly from increasing adapt_delta.
So I’m not sure how I can find the culprit. It’s a pretty simple model, and as I’ve shown above, the data aren’t spectacularly wacky. And as I said, all works fine when I turn off the truncation.
Would you have any additional suggestions? Is there any cause for concern with the way that truncation is presently implemented in Stan?
The thing is that I don’t have small varcomp3 values – the smallest any value ever gets to in warmup is around 0.7. I do have some negative mu[i]. But there aren’t many, they’re not very negative (only go to -2 or so), and I would have thought the rest of the distribution would have swamped this out.
This also doesn’t explain why it all works fine when I simulate data from the truncated normal, which has more mass near zero than my data. As an extra sanity check, I replaced my observations with values sampled from a truncated normal without changing the grouping structure. So in other words, I retained my data’s structure. Again, it all worked fine within 100 iterations. I think this clearly shows that it is not the model.
It looks like it gets stuck within the initial fast adaptation window. However, I tried increasing this massively and it didn’t change things. The step size still got down to <1E-8 within about 25 iterations.
I don’t think the HMC should break so easily given the data I’ve plotted above. I really think this is happening because, as I said above, the model works with all my covariates when using values of y[i] strictly drawn from a truncated normal. Something about my true y[i] is setting Stan off.
Can I ask what are some common causes of this? Is there any reading that you can direct me to? Sounds really fascinating, despite being a big pain to me at the moment.
I have looked at the real data and aside from some extremely small values (which don’t make much difference if removed), I can’t really see a stark difference from the simulated data.
My workflow is based on the assumption that if the model can’t handle the data I have it’s too fragile. Stan gives me the tools to figure out why the model is fragile so I just do that and move on. Your focus on the data and what’s wrong with the data is interesting and I think it would be cool to figure out, I’ve just rarely done it so I can’t give common causes.
… How’s the plot of iteration versus acceptance rates look for the real data?
Oh yeah , we’re still trying to convince people to do model checking past MAE so no literature I can think of. Maybe somebody else but I’d ask a separate question for that.
I think it looked a bit better if I raised adapt_delta = 0.999 and max_treedepth = 14, but not by much. I can post that when it finishes running if you want because it takes a fair bit of time as it consistently hits max_treedepth.
One alternative that I’ve tried to explore is a translated (or 3-parameter) Weibull (Weibull distribution - Wikipedia). But I’ve never coded a custom PDF in Stan. I can get it to run, but getting it to mix is another issue. I’ll create a separate question about that if that’s okay? Thanks again!
I wouldn’t change distributions quite yet because you don’t know why this model is fragile so you might just do a bunch of work to end up here again. Unless you are getting divergences raising adapt_delta is not the thing to do. Stan will lower the stepsize to get the acceptance up to adapt_delta. You could try lowering it to 0.7 and see if the adapted stepsize gets bigger.