I am currently trying to create a spaghetti plot without a mean regression line using conditional_effects. I thought that mean = FALSE could be used to remove the regression line. However, despite adding it in the conditional_effects-code, I still get a plot with a regression line.
So there are two options that I know of for making this happen. The first is to create the object as you have and then manually strip out the white line from the resulting ggplot object. Now, I’m going to be sorry about the non-reproducible example here, but I have a brms model open for a project at this moment and used it to check that this works.
# Creating a plot and assigning it a name
test_plot <- plot(
conditional_effects(formula_one_fit,
effects = "syllRate_centered",
spaghetti = TRUE,
ndraws = 100)
)
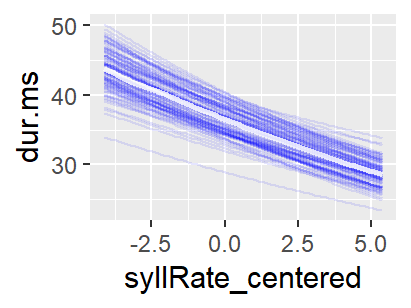
# Printing out plot (it has the white line)
test_plot$syllRate_centered
These plot objects have a structure to them, but the important part for this is that there are two layers. One with the spaghetti lines (first layer) and one with the white lines (second layer). We can just set this second layer to null with the following code:
# Removing the white line
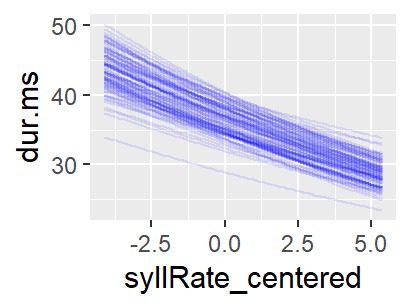
test_plot$syllRate_centered$layers[[2]] <- NULL
# Printing the plot again (now the white line is gone)
test_plot$syllRate_centered
The second option is to build these plots from scratch, which gives you more control over them. About two-thirds of the way down this vignette you’ll see examples of spaghetti plots: Extracting and visualizing tidy draws from brms models
Let me know if this first options works for your code!