Hello everyone,
I have some data from an experiment in which the participants were given a Likert-like scale. I say Likert-like because it is actually just a continuous scale with ticks at the numbers 1 to 7. So, participants can theoretically respond at any point along the continuous (but bounded) scale. In practice, responses tend to be pulled toward where the ticks are.
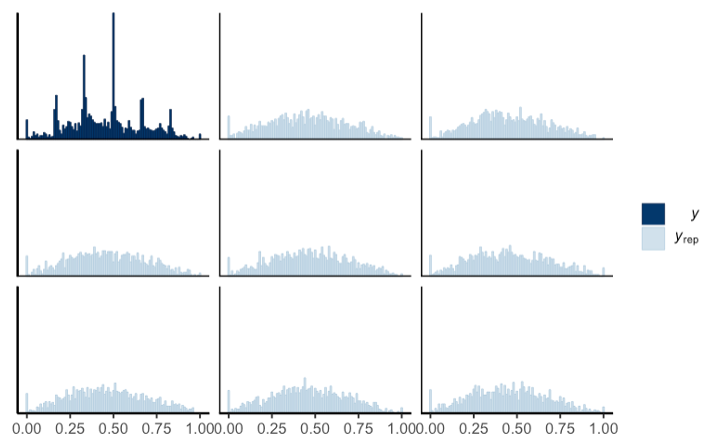
I’ve tried to run a gaussian model with a uniform prior between the minimum and maximum of the scaled variable, just to see how it works. The pp_check trace shows that the predictions are not so great, as they don’t replicate the spikes where each tick was in the real data:

[variable 1]

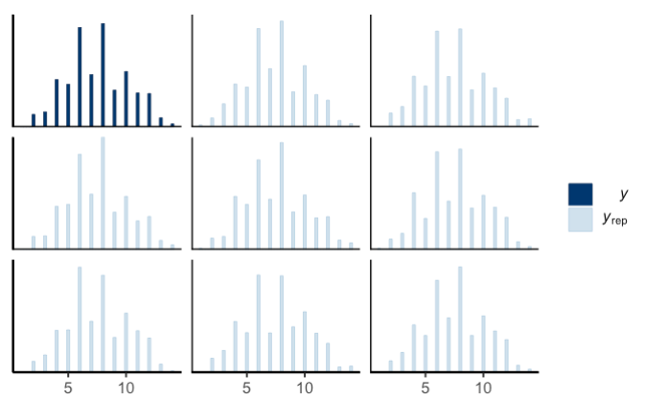
[variable 2]
It looks like the predictions are worse for the skewed variable (for which many participants answered 5 or 6 out of 7). Is there any way I can improve the fit here?
- Operating System: Mac OS Catalina
- brms Version: 2.15.0