I am new to stan and R and I was given simple example data to fit using brm. I have a dataframe of 500 rows and 3 columns. One column is treatment labeled 1, 2, 3, 4, or 5, a second column with a different mean for each treatment, and a third column with a response value with a mean around treatment mean with a sd of 3.
there are 100 different response value for each treatment 1 - 5 and 5 different means for each treatment.
data <- tibble::tibble(treatment = as.factor(1:5)) %>% # piping tibble(treatment) into mutate. tibble constructs a df
  dplyr::mutate( # allows you to manipulate dataframe
    treatment_mean = rnorm( # finding the treatment mean
      n = 5,
      mean = 10,
      sd = 1)) %>% # piping treatment mean into rowwise
  dplyr::rowwise() %>% # piping rowwise into do
  dplyr::do({ # do applies a function to each group (in this case rowwise)
    treatment_params <- . # the df
    tibble::tibble( # constructing a df
      treatment = treatment_params$treatment, # putting treatment into the df
      treatment_mean = treatment_params$treatment_mean, # treatment_mean into the df
      value = rnorm( # response value
        n = 100, # using 100 random Gaussian distribution values around the mean
        mean = treatment_params$treatment_mean,
        sd = 3)) # with a sd between 0 & 1 (default)
  }) %>%
  dplyr::ungroup() # removes grouping done by group_by

This is my model:
model_w_prior <- brms::brm(
  formula = treatment_mean ~ 0 + treatment,
  data = data,
  prior = c(
    brms::prior(normal(10,3),
                class = "b",
                lb = 0),
    brms::prior(normal(3,0.5),
                class = "sigma"
                ) ),
  iter=8000,
  control=list(
      adapt_delta=0.99,
      max_treedepth=12)
)
I get all of these errors:
Warning: There were 168 divergent transitions after warmup.
Warning: There were 1164 transitions after warmup that exceeded the maximum treedepth. Increase max_treedepth above 12.
Warning: There were 4 chains where the estimated Bayesian Fraction of Missing Information was low.
Warning: Examine the pairs() plot to diagnose sampling problems
Warning: The largest R-hat is 3.15, indicating chains have not mixed.
Running the chains for more iterations may help.
Warning: Bulk Effective Samples Size (ESS) is too low, indicating posterior means and medians may be unreliable.
Running the chains for more iterations may help.
Warning: Tail Effective Samples Size (ESS) is too low, indicating posterior variances and tail quantiles may be unreliable.
Running the chains for more iterations may help.
This is the output I receive:

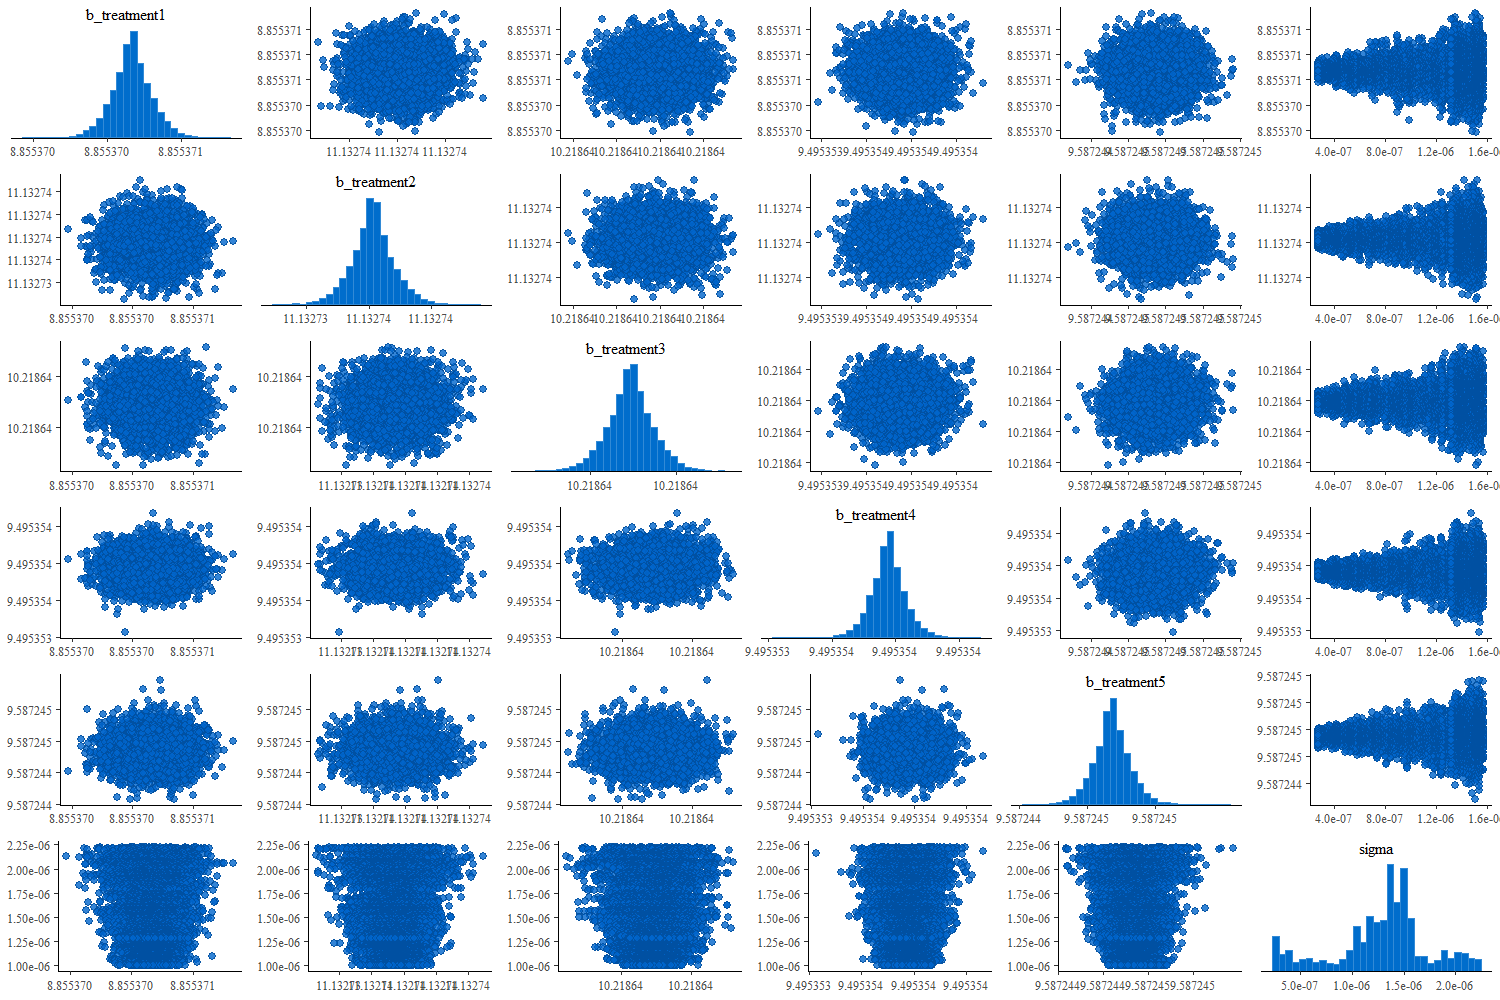
here is the pairs plot:
I have spent an exhausting amount of hours reading documentation and journals and tried increasing iterations, warmup, adapt_delta, treedepth, changing my priors to make them more or less informative, messing with the formula, changing my data (increasing and decreasing the number of samples, increasing and decreasing sd, increasing and decreasing mean). None of these seem to improve my model by very much. Any suggestions are appreciated!
(This is toy data to practice with so if there is something wrong with the data that is making this difficult, I am all ears for what that might be.)