I’m assisting with creating/fiting a model to reflect a somewhat simple, albeit skewed, dataset. The dataset contains two variables, reflecting outcomes of two slightly different diagnostic tests: one being a shorter version of the other. The outcomes were determined to be highly correlated using a multivariate normal model, as well as a multivariate student-t distribution model. However, the data is fairly skewed, and when we examined posterior predictive samples, the model produced a larger number of samples that had values quite a bit higher than the maximum point in our actual dataset. The figure below illustrates the problem, with the red dots indicating actual datapoints, and the black representing the predicted datapoints.
It seems as though a skewed model would more accurately capture the distribution of the collected data, but Stan does not currently have this capability innately. We’ve been following another post on the forum that has worked with this problem, and are currently testing the solution that was outlined there (Multivariate Skew Normal). However, we could use some guidance on whether this is the best way to go about working with this dataset, and if so, what priors would be most appropriate to use for the parameters. Any guidance as to how to go about solving this problem would be much appreciated! For the sake of ease, I’ve posted the Stan code we’re working with below, we made a few slight additions/modifications, but credit must go to the original authors bgoodri and samreay.
data {
  int<lower=0> n;
  vector[2] x[n];
}

parameters {
  vector[2] xi;
  vector<lower=0>[2] omega;
  vector[2] alpha;
  cholesky_factor_corr[2] L;
}

model {
  target += multi_normal_cholesky_lpdf(x | xi, diag_pre_multiply(omega, L));
                                                                             /
  for (i in 1:n)
    target += normal_lcdf(dot_product(alpha, (x[i] - xi) ./ omega) | 0, 1);


  xi ~ normal(0, 100);
  omega ~ cauchy(0, 3);
  L ~ lkj_corr_cholesky(1);
  alpha ~ normal(0, 100);

}

generated quantities {
  matrix[2,2] cov;
  cov = diag_pre_multiply(omega, L);
}
Since this code is based on the multivariate skewed normal model by Azzalini et al, we’re hoping to use the function ‘rmsn’ from the ‘sn’ package to generate sample datapoints using the Stan fit, since it is based on the same distribution/model. However, we’re open to other suggestions of how to generate samples.
I might be missing something basic, but what is your actual research question? E.g. why is a multivariete normal a desirable model and why would fitting a linear regression (which would IMHO handle the skew easily) not provide the answers you are looking for?
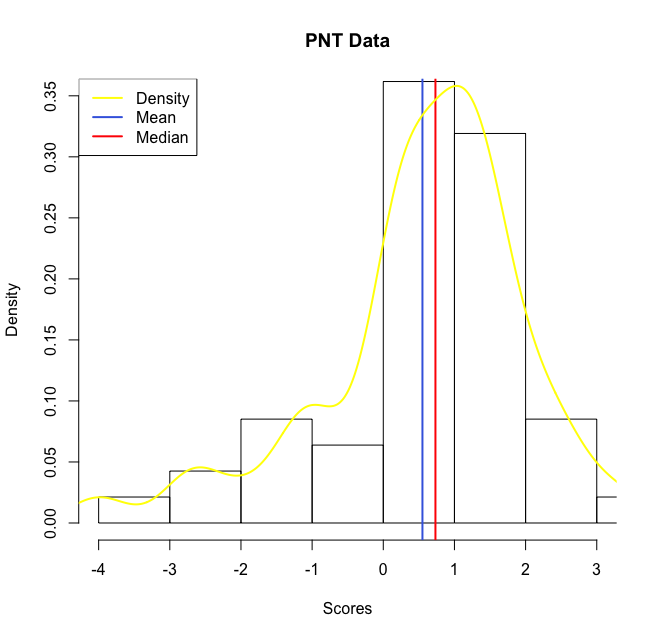
The skewness statistic for the first plot’s data is -0.8687679, and for the second plot: -0.9557496. My understanding is that these skewness statistics imply that the data is moderately skewed (and it certainly appears that way to me, from visually inspecting the data!). However, we are open to other input on how to analyze the data, which leads me to the next question…
As far as the choice of model goes, I followed up with the PI of the study (I am new to the lab, and rather new to statistical analysis as a whole–but it’s incredibly interesting so far!), and here is his response:
“The main reason is that correlations have been used extensively in the psychometric literature as a first “lens” before conducting more sophisticated/complex modeling. In this particular case, a correlation was estimated and was published ignoring the skewness and we are interested in evaluating (for future reference) whether accounting for the skewness could have led to substantially different conclusions. In addition, and call it scientific curiosity or just stubbornness, we would like to be able to understand how to fit a bivariate skewed distribution to derive a simple statistic like a correlation; and, if not, we would like to be able to understand why estimating what appears to be a very simple model, may be beyond our reach.”
Again, we are open to other possible methods of analysis, and would welcome input regarding potential approaches to take. It seems like this approach, however, should be possible…
One thing to note is that Pearson correlation is equivalent to a simple linear model, as described for example here: Common statistical tests are linear models (or: how to teach stats) So whenever you believe correlation is sensible, a linear model is also sensible. On the other hand, fitting bivariete normal brings in additional assumptions - correlation (and linear model) is a statement about relationship between two variables. Bivariete normal makes a statement about relationship, but it also makes a statement{assumption about the marginal univariete distributions. The latter assumption about marginal distributions is missing from correlation/linear model and it is this assumption that seems to be violated in your data.
The fact that marginal distributions are skewed does not by itself invalidate the correlation/linear model.
If you have scientific reasons to make statements/assumptions about the marginal distributions, then you may consider to fit a multivariete skew normal as you indicated - if this is the case, the priors should probably be motivated by the theoretical background of your scientific inquiry and/or prior predictive checks: [1709.01449] Visualization in Bayesian workflow.
This is great, thank you so much. Again, apologies for the newbie-level question, but I’m having trouble integrating the datapoints we’re trying to model into the code you provided. We’re working with a pretty small dataset, as seen above, but I’ve tried adding it to the list of data as a vector (vector[2] x[n]), and as a matrix, and keep running into issues. Any suggestions?