Hello,
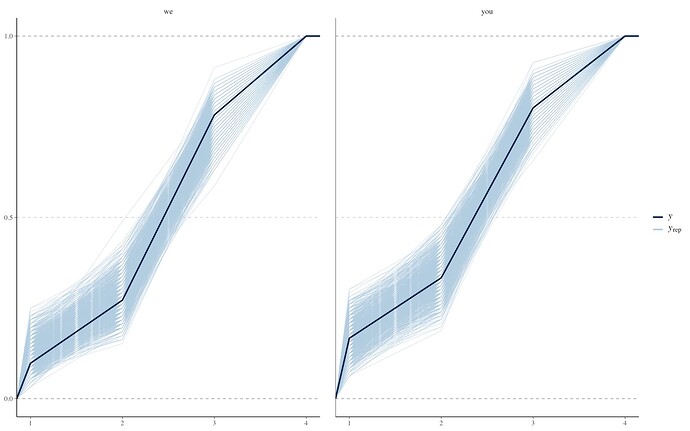
I am currently fitting a hierarchical ordinal model in brms (rstudio 4.3.2., brms 2.20.4, mac os 14.2.1). My issue is indicated by posterior predictive checks, specifically dens_overlay and its grouped versions. The posterior model occasionally predicts far too many of each category of the ordinal outcome (and especially the third category, by far the most common in my dataset). This is shown, below, for the overall dataset and the grouped dataset for a key predictor. It leads me to think that I shouldn’t trust the accuracy of the posterior estimates. This is especially so because the fitted model is rather confident (with Pr(x > 0|D) > 0.95) about an effect of a predictor called “condition_framing,” despite the fact that the raw distribution of the data by level of condition_framing suggests at most a negligible effect.
However, other ppc’s look okay, e.g.,
My question is whether it seems appropriate to trust the estimates of this model (or other ways in which this might be determined) or, if not, any suggestions about how I might improve the fitted model’s predictions.
My data is 192 observations from 96 participants (2 trials/participant). The outcome is a four-category “informativeness” scale, from none < minimal < moderate < maximal. Predictors are a mix of discrete and continuous variables. The model fits without any obvious issues (no divergences, r-hat okay, trace plots okay).
The plots above are from the following fitted model:
mod <- brm(family = cumulative("probit"),
           data = wepd_data_included,
           formula = informativeness ~ condition_framing * condition_discourse + trial + age_standardized + ref_latency_standardized + sex + location + e1_binary + ref_item + (1|participant_id),
           control = list(adapt_delta = 0.85),
           init = "0",
           cores = 7,
           chains = 7,
           iter = 5000,
           prior = c(prior(normal(0, 1.00), "Intercept"),
                     prior(normal(0, 0.80), "b"),
                     prior(normal(0, 1.00), "sd")))
The posterior predictive plots, above, look essentially identical regardless which subsets of the predictors I include in the model (from an intercept-only model up to the larger model, above), choice of reasonable priors, choice of alternative ordinal response models (e.g., acat), or modeling of distributional parameters (disc).
The data used in the model may be downloaded here:
wepd_data_included.csv (43.4 KB)
Thank you in advance for any help. I am happy to provide more information or code if that would be helpful.


