While I have used frequentist mixed model for the last several years, I have only delved into Bayesian approaches over the last few. Bayesian analysis and reporting are still somewhat rare in the fields I work in, so I’m unsure of the validity of some of my reporting techniques.
I typically provide a regression summary table with mean/median coefficient/parameter estimates and an 89% CI.
In cases of logistic models (binomial, bernoulli, ordinal), I have been using the fantastic tidybayes package to generate fitted draws (response probabilities) and then with guidance from the research team designating ROPE boundaries as a way of presenting modelling results in an intuitive manner.
Is this approach valid?
For example:
This is from a bernoulli family model:
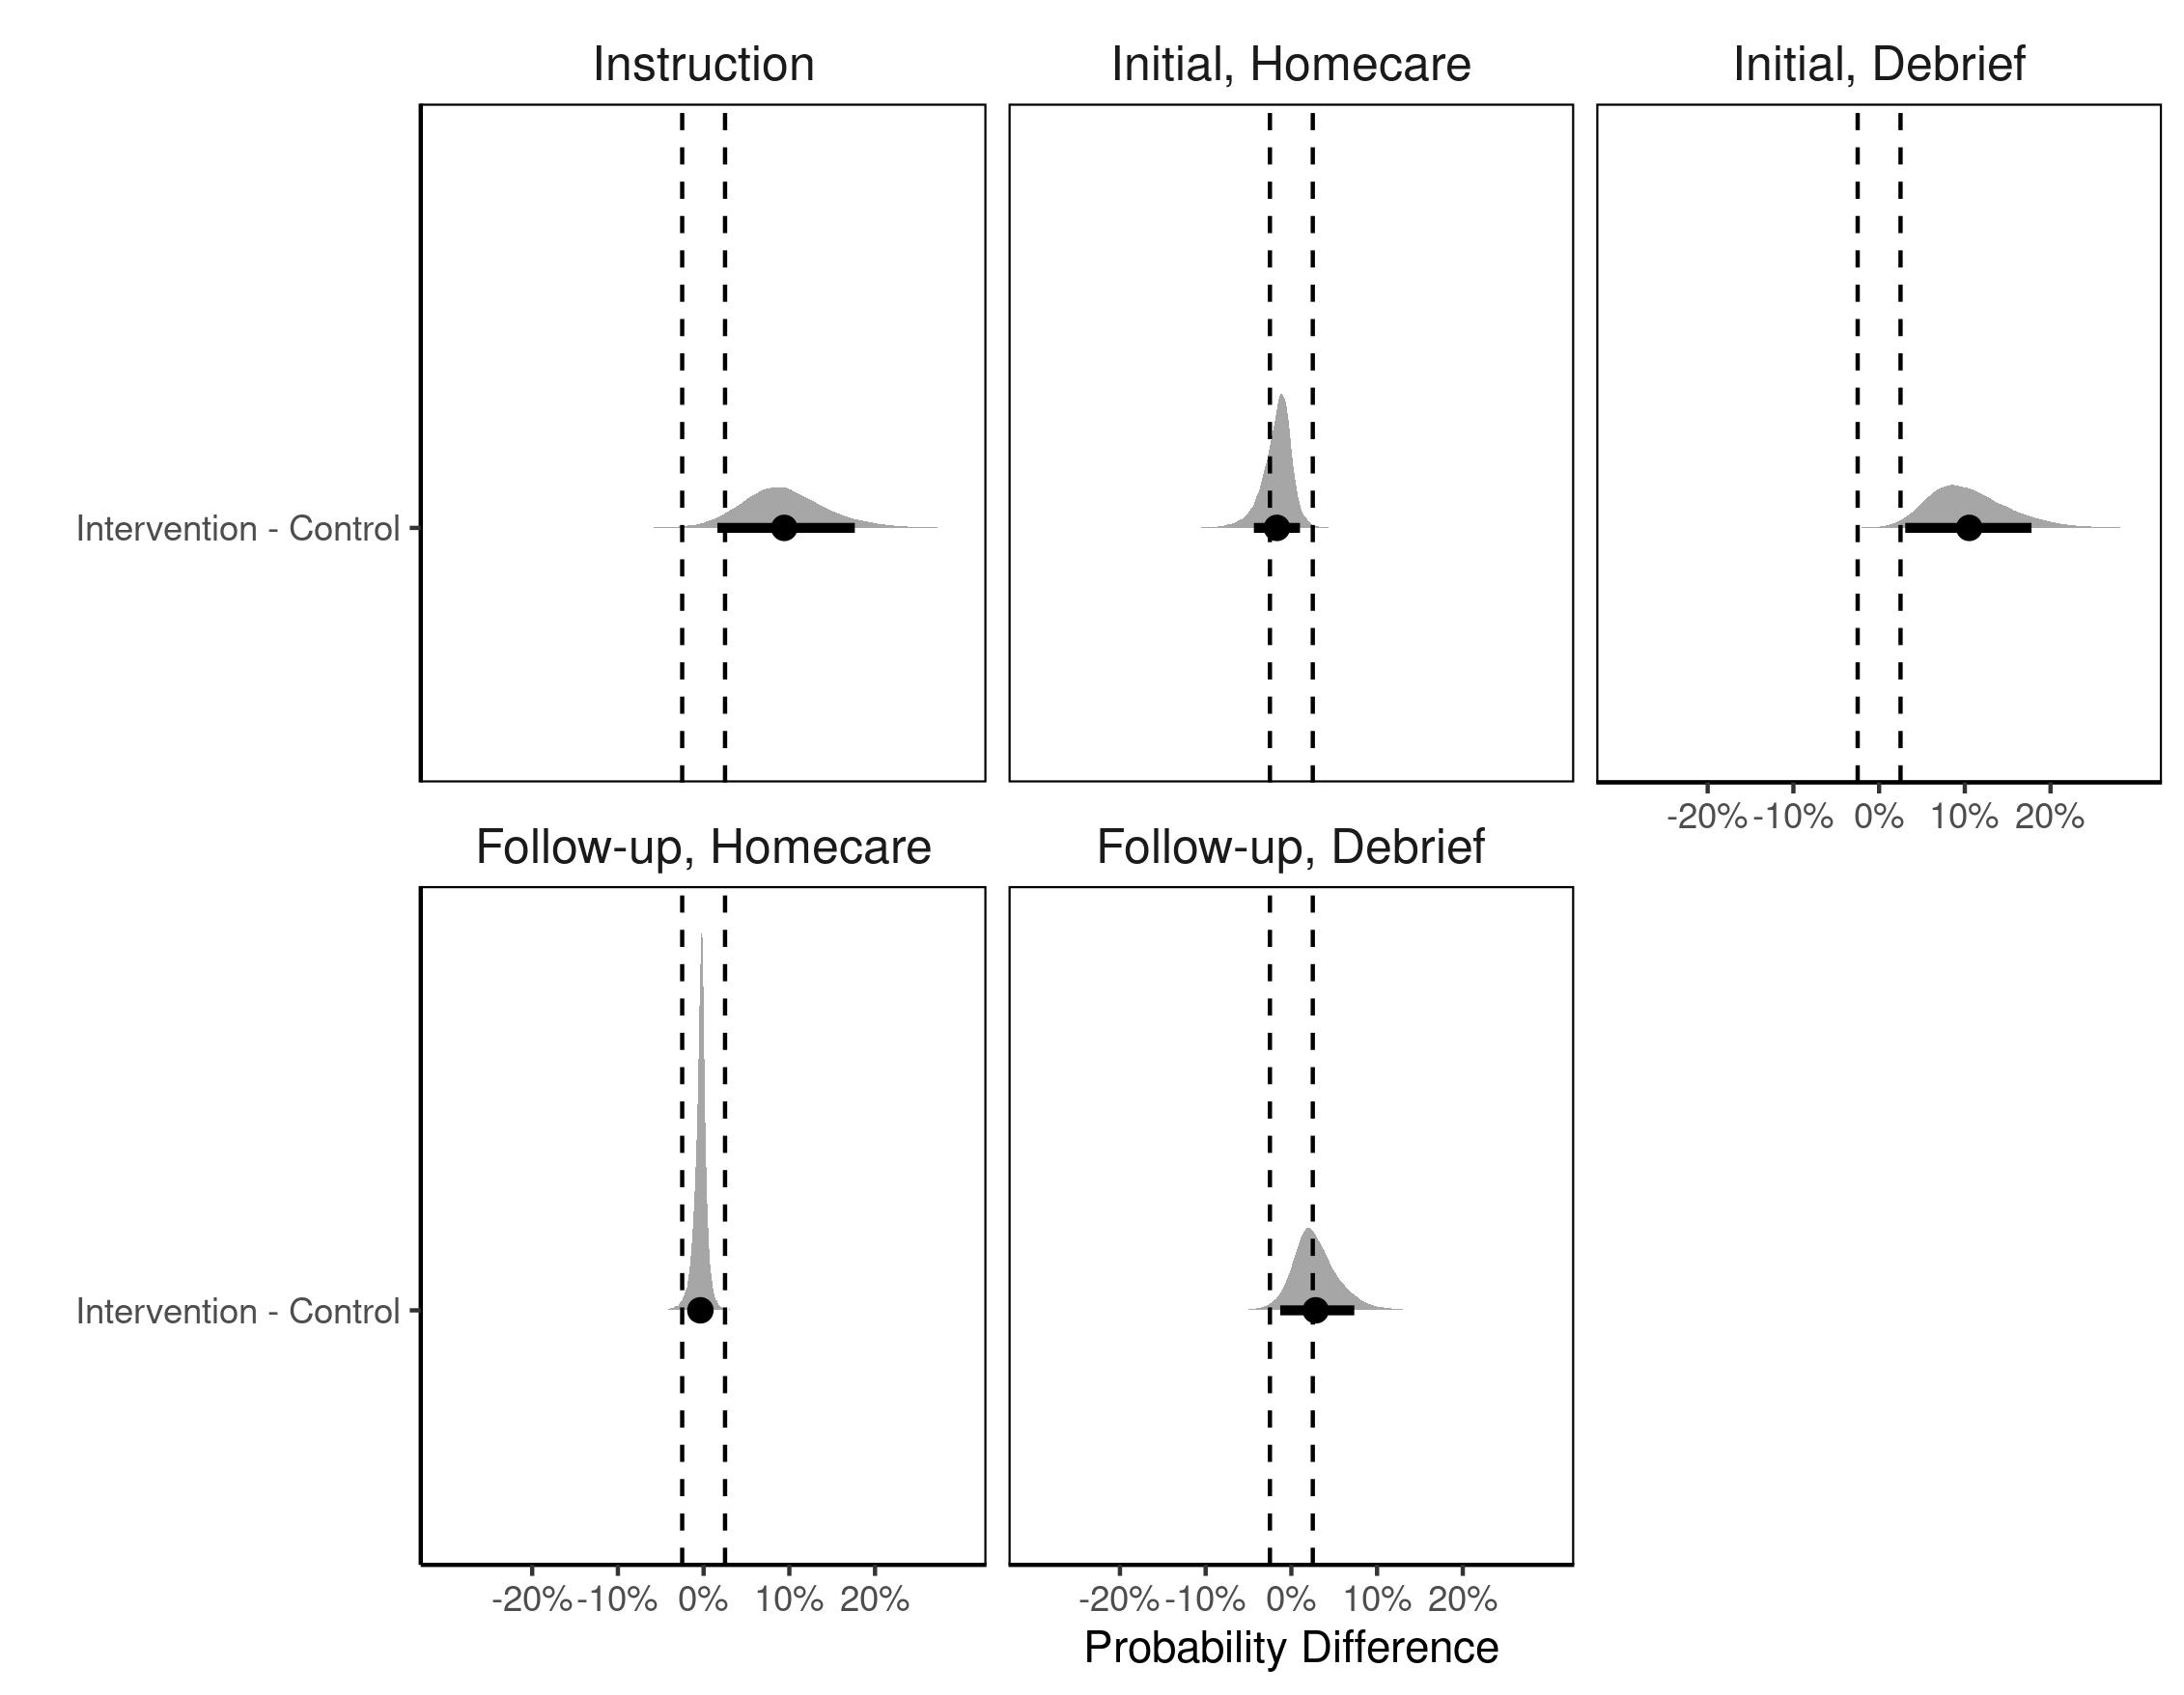
To produce this plot, I use add_fitted_draws to add predicted response probabilities and then use compare_levels to create the probability differences. Then I manually add the ROPE boundaries to the figure and accompany the figure with a table of percentages of the probability difference distributions inside the ROPE computed from in bayestestR.