Continuing the discussion from Heckman selection model code + simulation, I am building a hierarchical version of these models for a project.
I’m running into an unusual situation: the HMC seems to work fine, but the calibration/interval coverage is bad. Usually, the HMC fails spectacularly and signals the problem. But not here.
In simulations I did (code below) the 50% intervals cover only about 30% of the truth, 95% intervals cover only 75% of the truth. I’ve done the usual recentering already. No DTs at all, allegedly, pairs and traceplots both look fine as far as I can tell – though the traceplots do display a little bit more serial correlation than one would like, to my eye. This is very unusual to me! Usually It’s DTs all over the place at the first sign of a problem. I’ve put all of this and working example with the calibration test below. Let me walk through the model first.
I start with a classic heckman selection model from the other thread which works great and is calibrated perfectly. Then I add a “lower level” to the model where instead of observing the data from the selected units (the y1s) I observe an unbiased but noisy signal of them, y1_hat, with known SD, y1_hat_sd.
This is basically 8 schools stacked onto a heckman model. And yet! It doesn’t cover the space properly. I wondered if lack of global concavity of the heckman likelihood might be interacting with the hierarchy in some bad way, but i don’t think it should, because the hierarchy only activates conditional on the unit being selected at all (whereas the unconditional inference is what poses the nonconcavity issue).
Here’s the model, which is just the same as the one that works from the previous thread, but with the y1_hat, y1_hat_sd added and some parameter transformation to do the re-centering trick:
data {
  int<lower=1> N;
  int<lower=1> N_neg;
  int<lower=1> N_pos;
  int<lower=1> D;
  vector[N_pos] y1_hat;
  vector[N_pos] y1_hat_se;
  int<lower=0,upper=1> y2[N];
  matrix[N_pos,D] X1;
  matrix[N,D] X2;
}
transformed data {
  int<lower=1,upper=N> n_pos[N_pos];
  int<lower=0,upper=N> n_neg[N_neg];
  {
    int i;
    int j;
    i = 1;
    j = 1;
    for (n in 1:N) {
      if (y2[n] == 1) {
        n_pos[i] = n;
        i = i + 1;
      } else {
        n_neg[j] = n;
        j = j + 1;
      }
    }
  }
}
parameters {
  real<lower=-1,upper=1> rho;
  vector[D] b1;
  vector[D] b2;
  real<lower=0> sd1;
  vector[N_pos] eta_y1;
}
transformed parameters {
  vector[N_pos] y1;
  vector[N_pos] mu_y1;
  mu_y1 = X1 * b1;
  y1 = mu_y1 + sd1*eta_y1;

}
model {
  vector[N] mu_y2;

  rho ~ normal(0,0.5);
  b1 ~ normal(0, 1);
  b2 ~ normal(0, 1);
  sd1 ~ normal(0, 1);


  mu_y2 = X2 * b2;

  for (n in 1:N_neg) {
    target += (log(Phi(-mu_y2[n_neg[n]])));
  }

  for (n in 1:N_pos) {
    target += log(Phi(sqrt(1 - rho^2)^(-1)*(mu_y2[n_pos[n]]
                               + (rho / sd1)
                               * (y1[n] - mu_y1[n]))));
  }
  eta_y1 ~ normal(0,1);
  y1_hat ~ normal(y1, y1_hat_se);
}
Here’s the accuracy for some run for the parameters we care about (the heckman parameters). Not very good (it’s a coincidence that in this run all 3 b1s are bad, across runs I haven’t seen a pattern except that sd1 is doing better than rho most of the time):

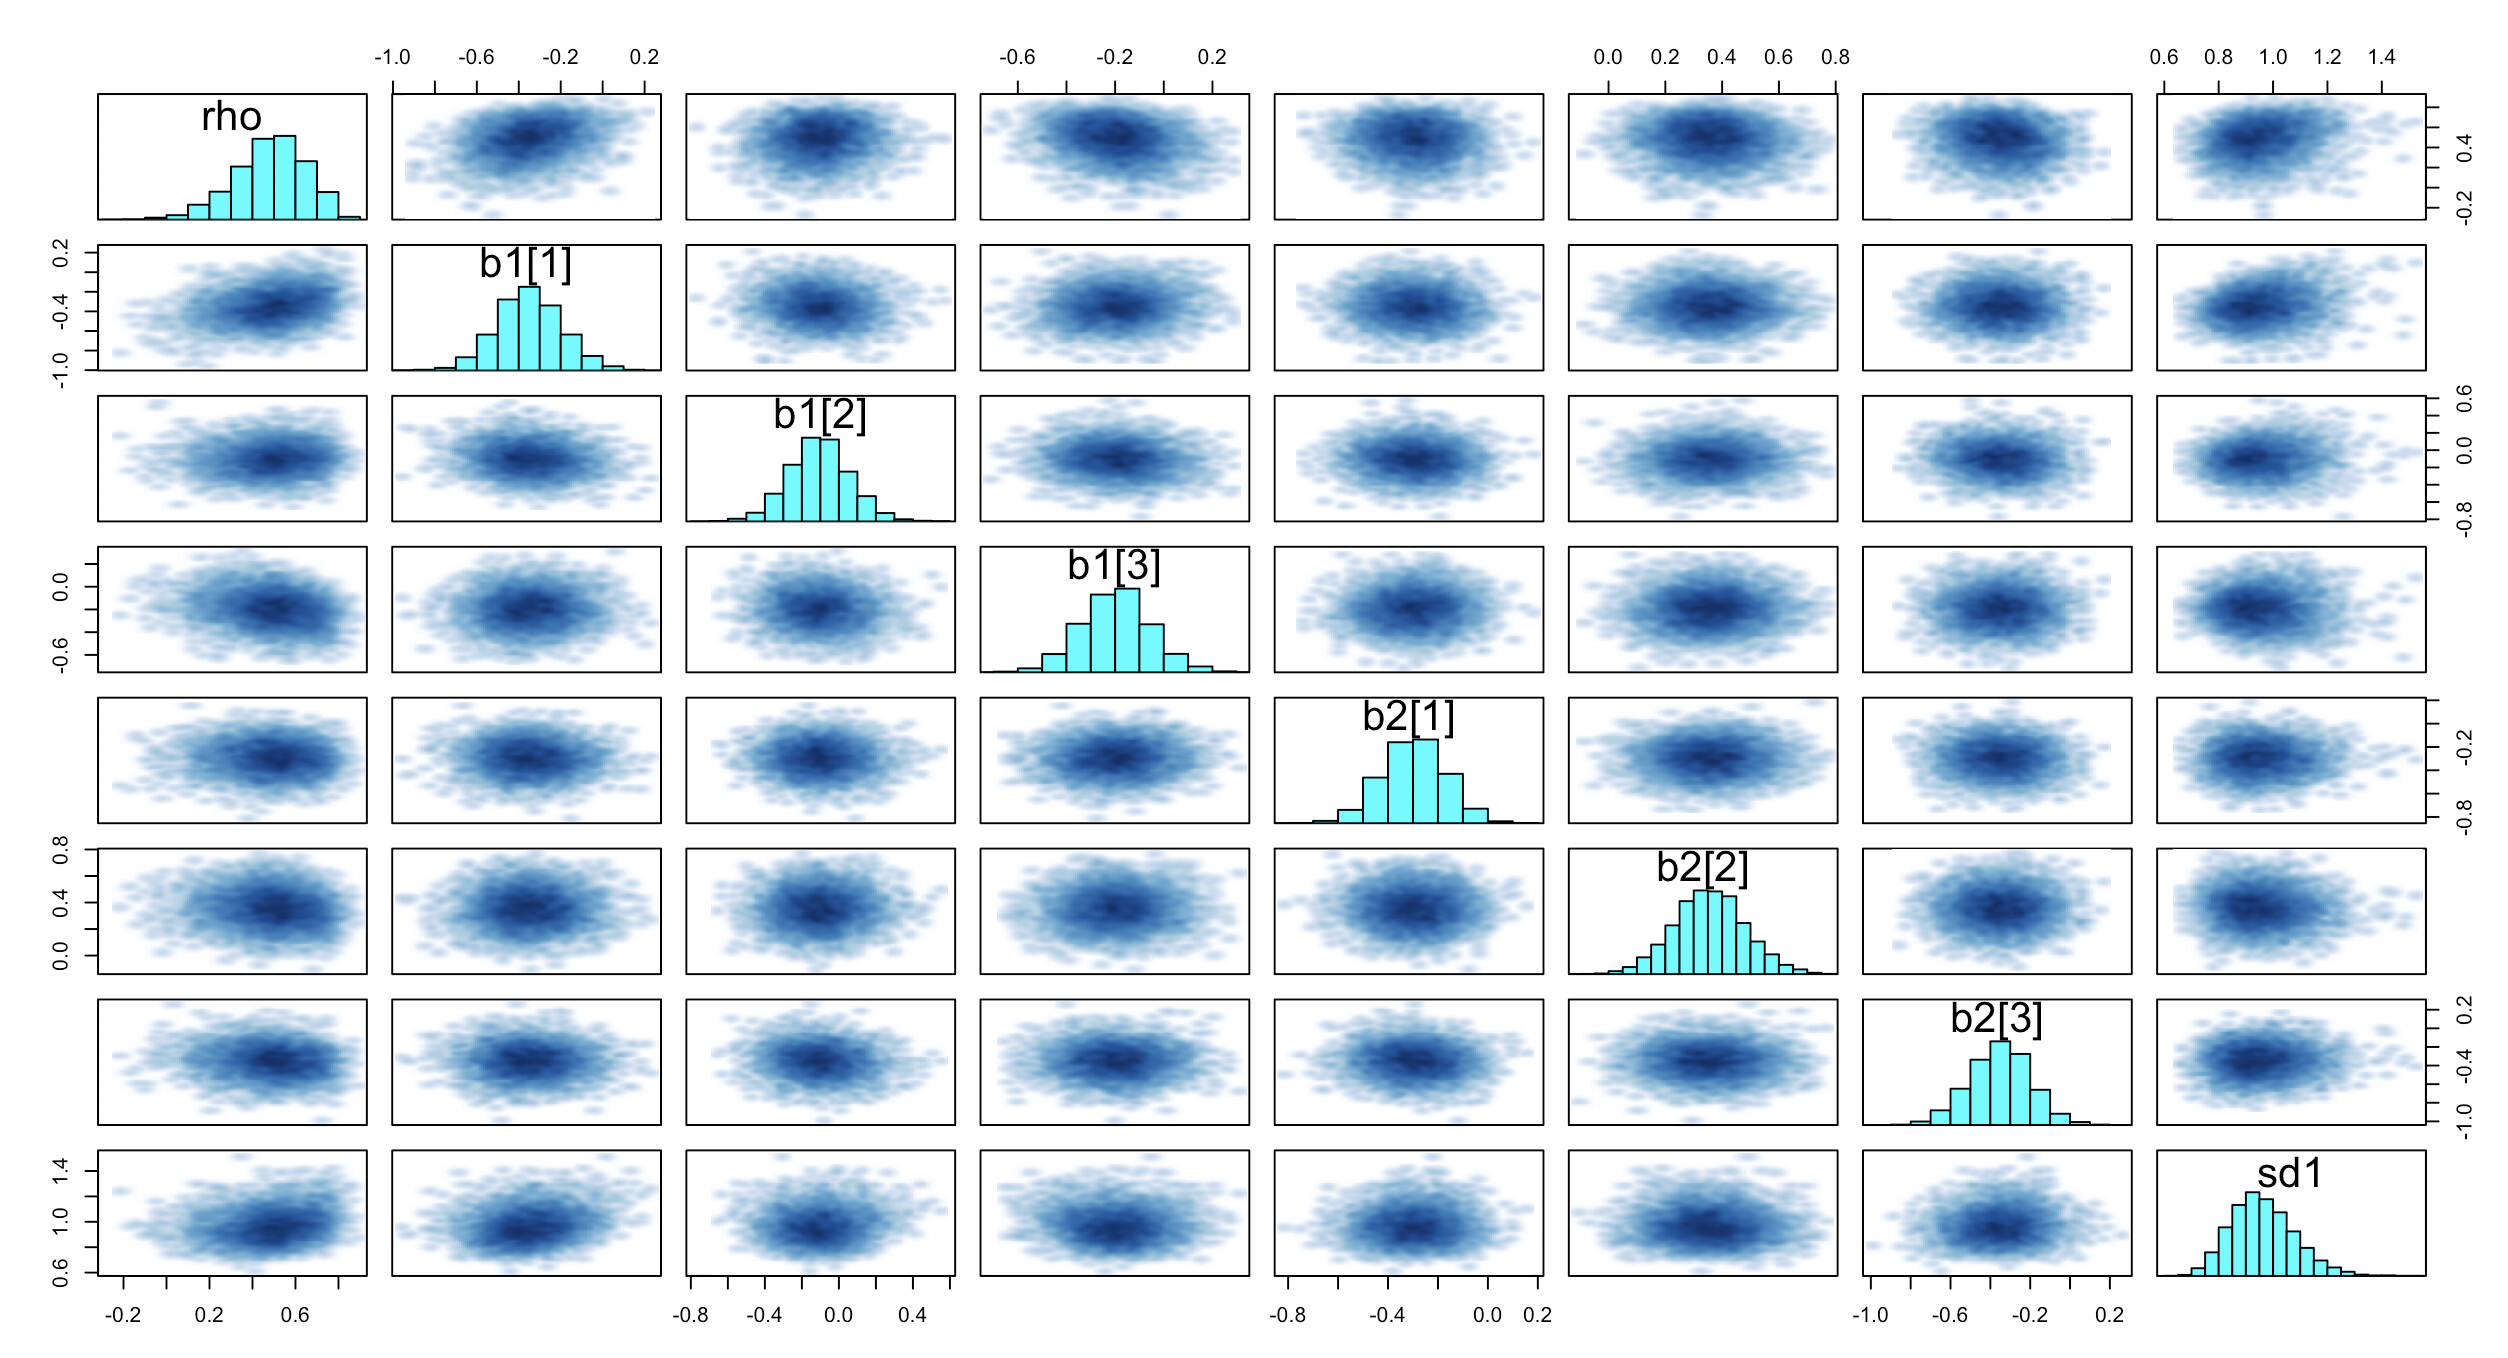
Here are the traceplots and pairs plots:

Here’s the stan file and the simulation file. Just run it with S = 1 if you want to do 1 run of the model.
fake_data_heck_hierarchical_montecarlo_calibration_check.R (3.2 KB)
heck_hierarchical.stan (1.3 KB)
Does anyone see any clues in the trace or pairs plots that I have missed? Or any other errors I’ve missed here, or have any thoughts about what might be going on here? I am worried that I am losing my mind and have set up the hierarchy wrong and just can’t see it…
