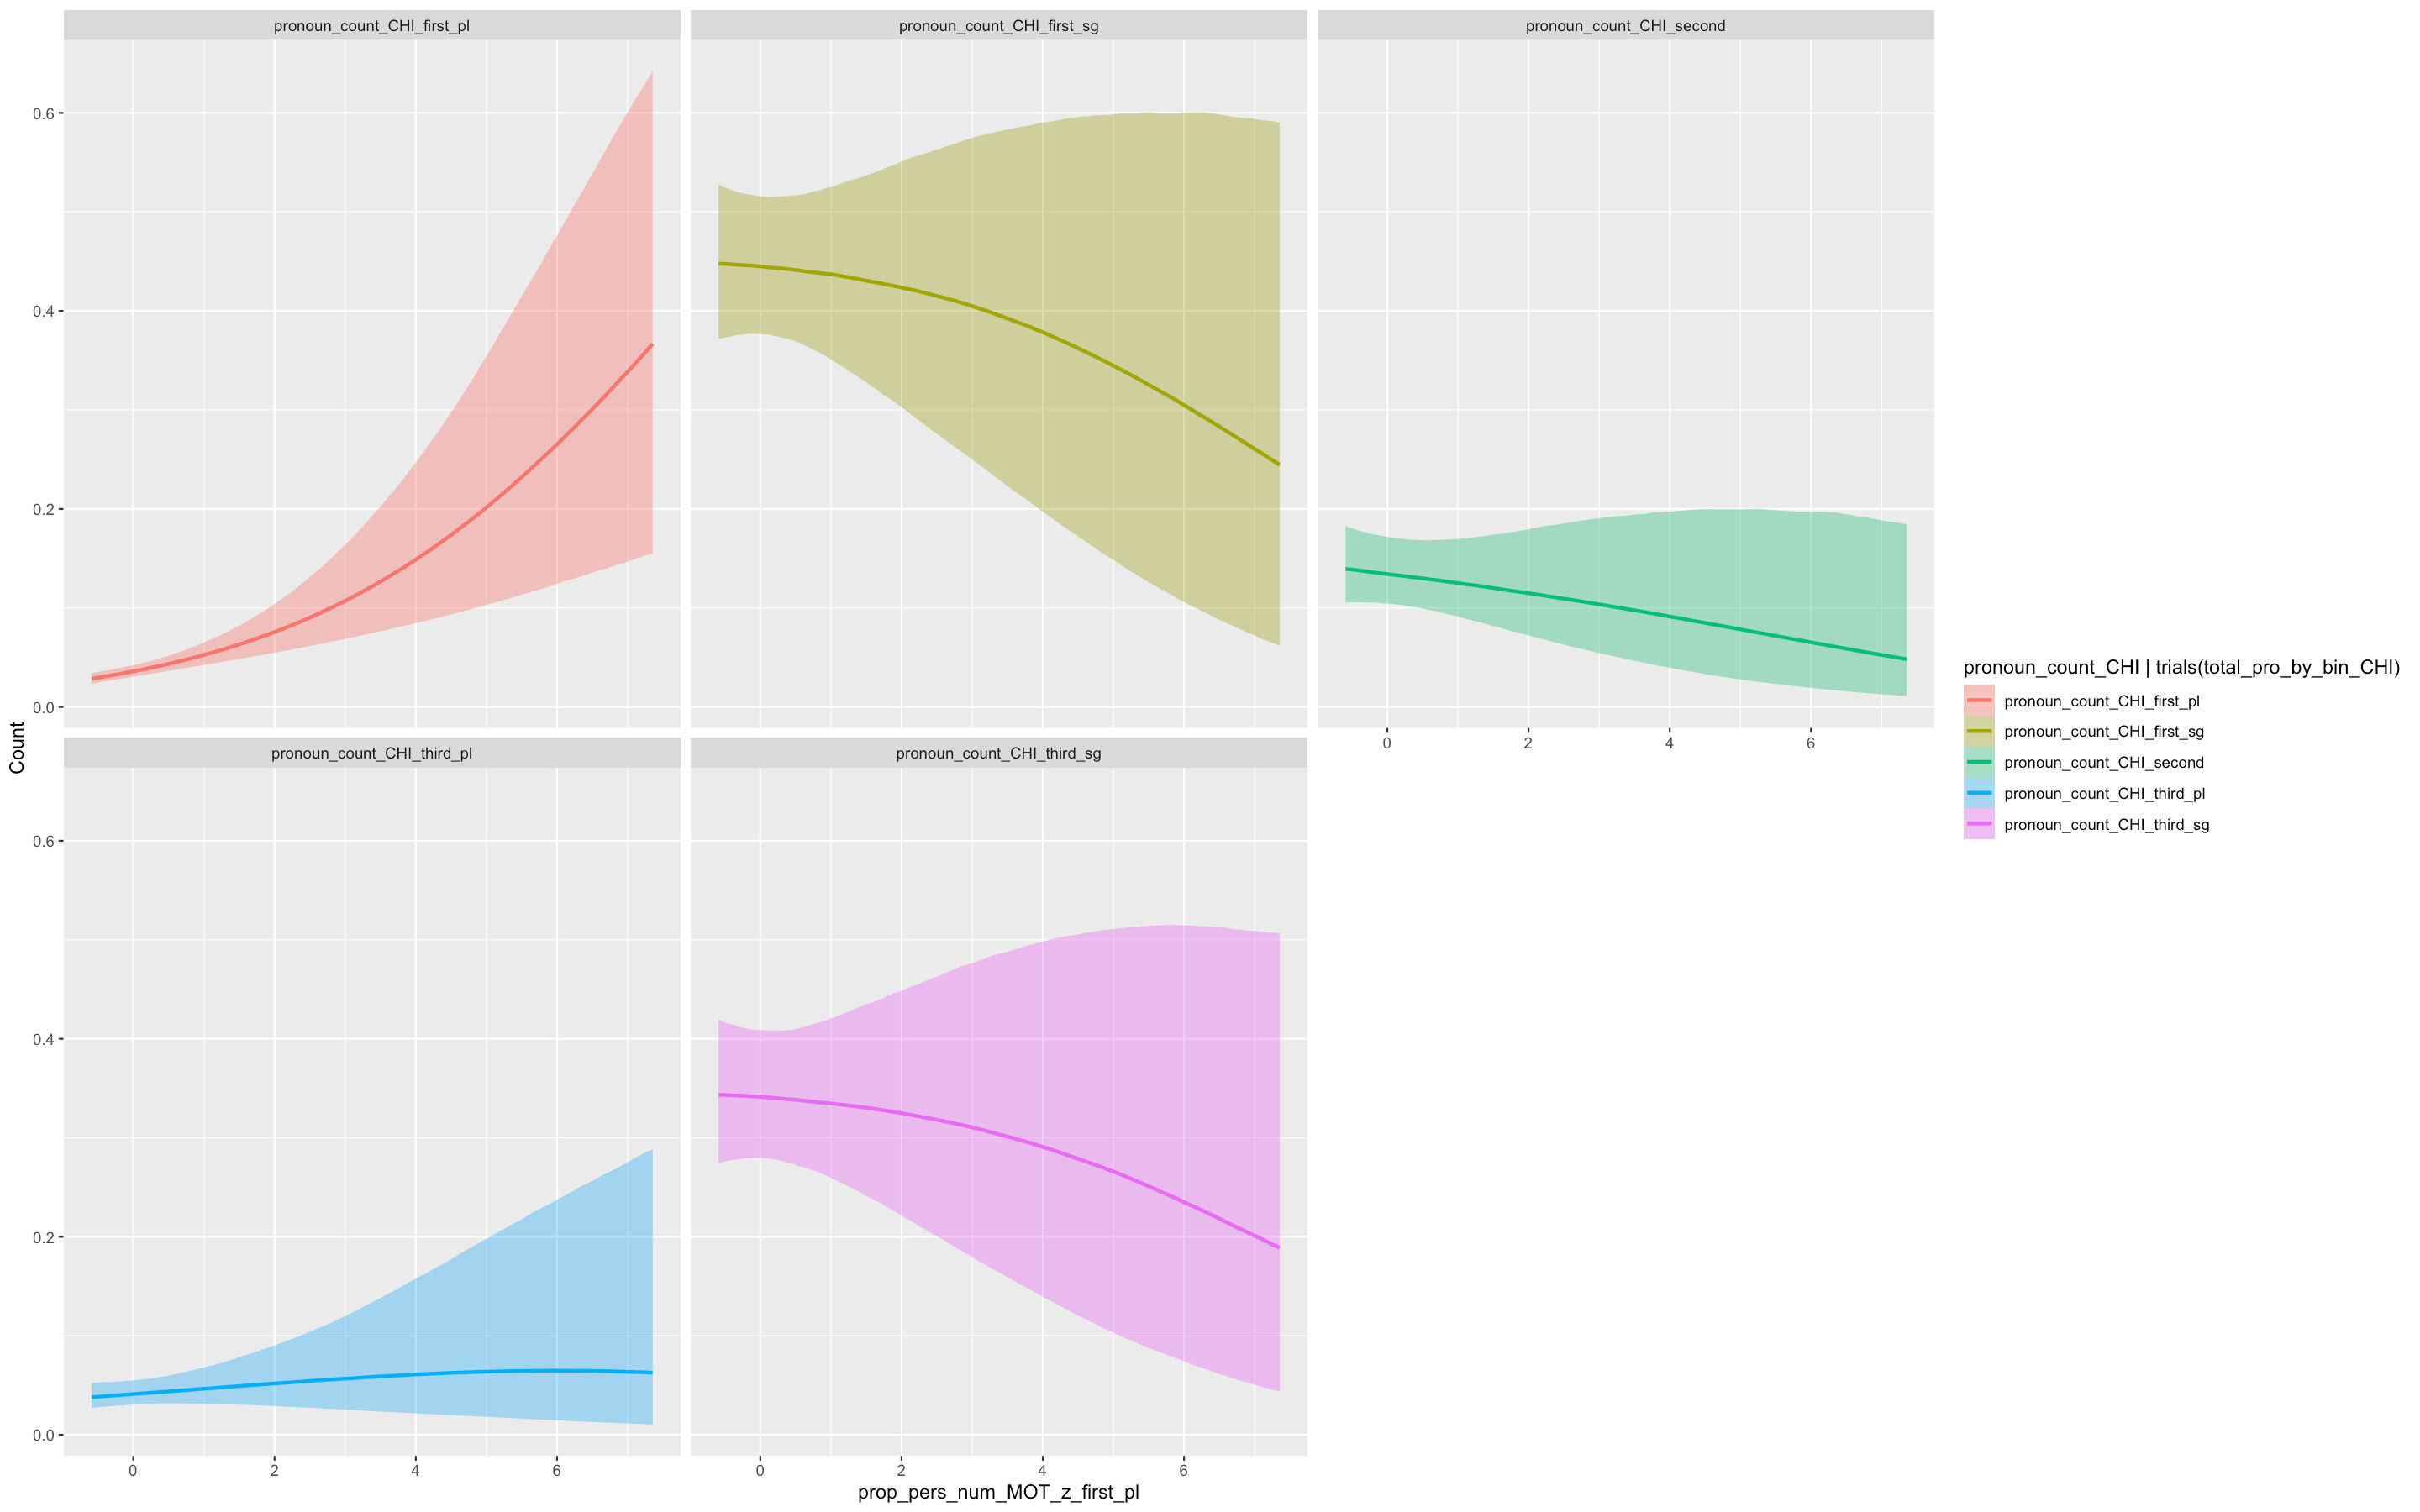
Essentially, I wish to produce only the top left plot (i.e., the level of “cats__” called “pronoun_count_CHI_first_pl”), and to not produce any of the other four plots.
conditional_effects generates a list of data frames (one for each effect) that is then used as the data for the plots. I think if you update the relevant data frame(s) to keep only rows where the outcome is pronoun_count_CHI_first_pl then you’ll get a plot only for that outcome.
I don’t have your model, so I can’t test, but I think it would be something like this:
library(tidyverse)

ce = conditional_effects(mod_pro_multinom, categorical = TRUE,
                         effects = “prop_pers_num_MOT_z_first_pl”)

# Look at the structure of the ce object
str(ce)

# Update the first (and only, in this case) data frame
ce[[1]] = ce[[1]] %>% filter(cats__ == “pronoun_count_CHI_first_pl”)

p.ce = plot(ce, plot=FALSE)
p.ce
The result should be a plot with just the one outcome category instead of all of them.
The code you tried did not work for a few reasons: Most importantly, plot(conditional_effects(... creates a plot using the data frame(s) generated internally by conditional_effects. AFAIK, the data can’t then be externally altered after the plot object is generated (at least not without some hacking outside of a standard ggplot workflow).
There are also two syntax errors: First, filter is not a ggplot function and can’t be “added” to a ggplot with +. Second, if you could filter, the code would be filter(cats__ == “pronoun_count_CHI_first_pl”). Note that there are no quotation marks around cats__. “cats__” is a string that doesn’t refer to anything else. "cats__"==“pronoun_count_CHI_first_pl” is always false and will return zero rows of data (try, for example, iris %>% filter("Species"=="setosa")). On the other hand, cats__ is the symbolic name that refers to the object (a data column) we want to filter.