I have an idea which might be either useful or perhaps is something well-known that I’ve just “rediscovered”. This post is a sort of TL;DR for a longer essay that I’ve put on my github here. That link contains all the code and more detailed discussion as well.
In some random effects models, the contribution of group differences to total variation is measured with the “interclass correlation coefficient” (ICC). The trouble is that the ICC:
- Doesn’t have any uncertainty estimates – since it comes from a model, we have to represent a distribution of possible correlations consistent with the data
- Only works sometimes. There are only a few models for which there are formulae to calculate ICC, and a wide class of flexible models are left out with no clear way to proceed.
Here I’m suggesting an approach to calculate the ICC based on a Bayesian posterior distribution for the model coefficients. The approach is heavily based on the Bayesian R2 (Gelman et al. 2019). The approach I’m suggesting replaces a single value of ICC with a distribution. However, for models beyond simple intercept-only models, this ICC calculation produces a curve, ICC(x), because in these cases the contribution of group effects depends on the rest of the model.
Typically the ICC for a model like this:
would be calculated like this:
the ICC is a ratio of the hyperparameter \sigma_{\text{group}}^2 to sum of that hyperparameter and the residual variance, \sigma_{\text{obs}}^2.
Bayes R^2 reminder
Gelman et al.'s Bayes R2 value from the paper I linked above is calculated like this:
Here \mu is the model fitted values:
We also need the residual variance. To make it general, we use the expected residual variance like this:
There is more code and a worked example in Aki Vehtari’s helpful workbook on the topic
proposed ICC(x)
The approach I’m suggesting is basically the same equation in two dimensions. The recipe goes like this:
-
For each posterior sample \theta^s, draw K groups from the hyperpriors that define the groups. Typically this will be a univariate or multivariate gaussian distribution. Each group has its id number: 1 ... k ... K. You end up with a matrix of group-level parameters, with dimensions S and K.
-
Create a smooth vector of x values to predict across, within the range of your original x values. Make M of these values, x_{\text{min}} ... m ... x_{\text{max}}.
-
For each value m, AND for each posterior sample s calculate the variance across all the K groups when x = m :
What this snarled notation is meant to convey is: We can calculate the ICC in a very similar way to the bayes R^2 value. In this case, instead of calculating the variance across all the n observations of X, we calculate the variance across the k groups for some particular value of x, say when x = m.
What it looks like
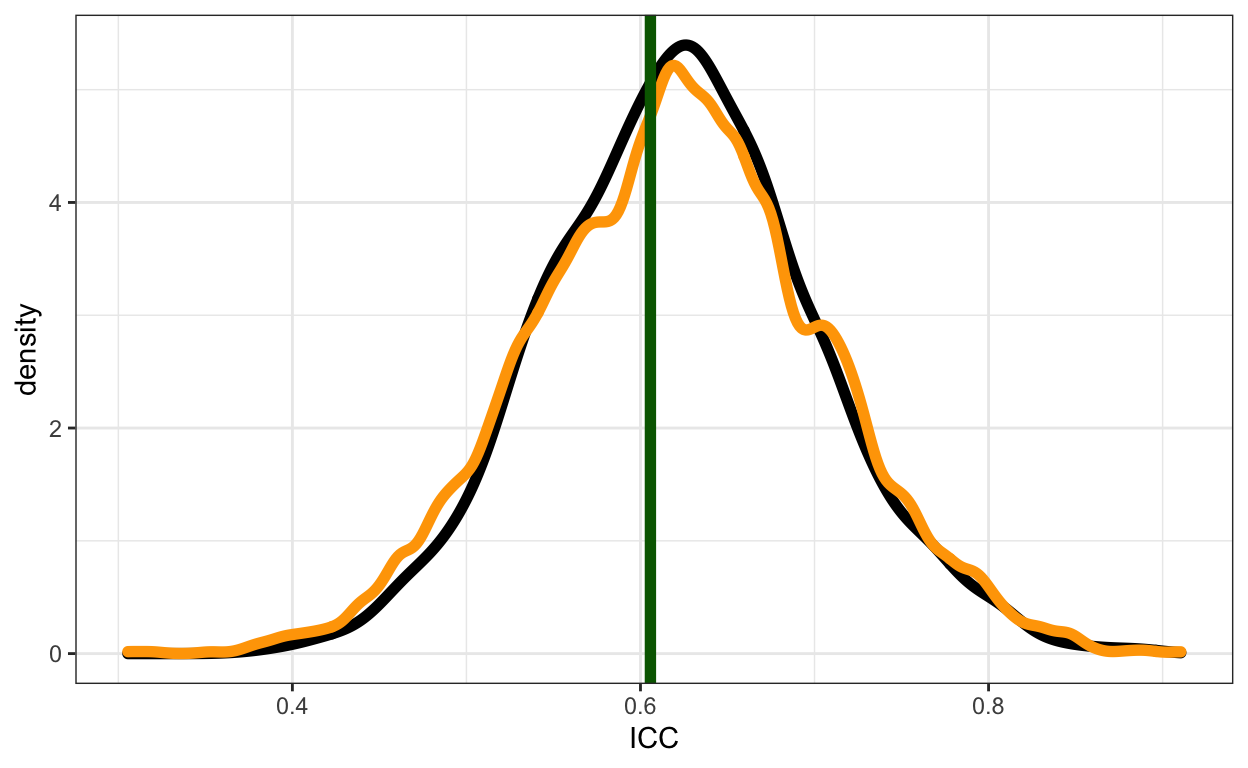
For simple univariate models, I was encouraged to find that the classic frequentist calculation, the Bayesian posterior (using the same formula) and my proposed simulation-based alternative give about the same answer (green line, black curve and orange curve respectively):
So I went ahead and applied it to several contexts where the existing ICC calculations don’t work at all.
and it looks .. novel
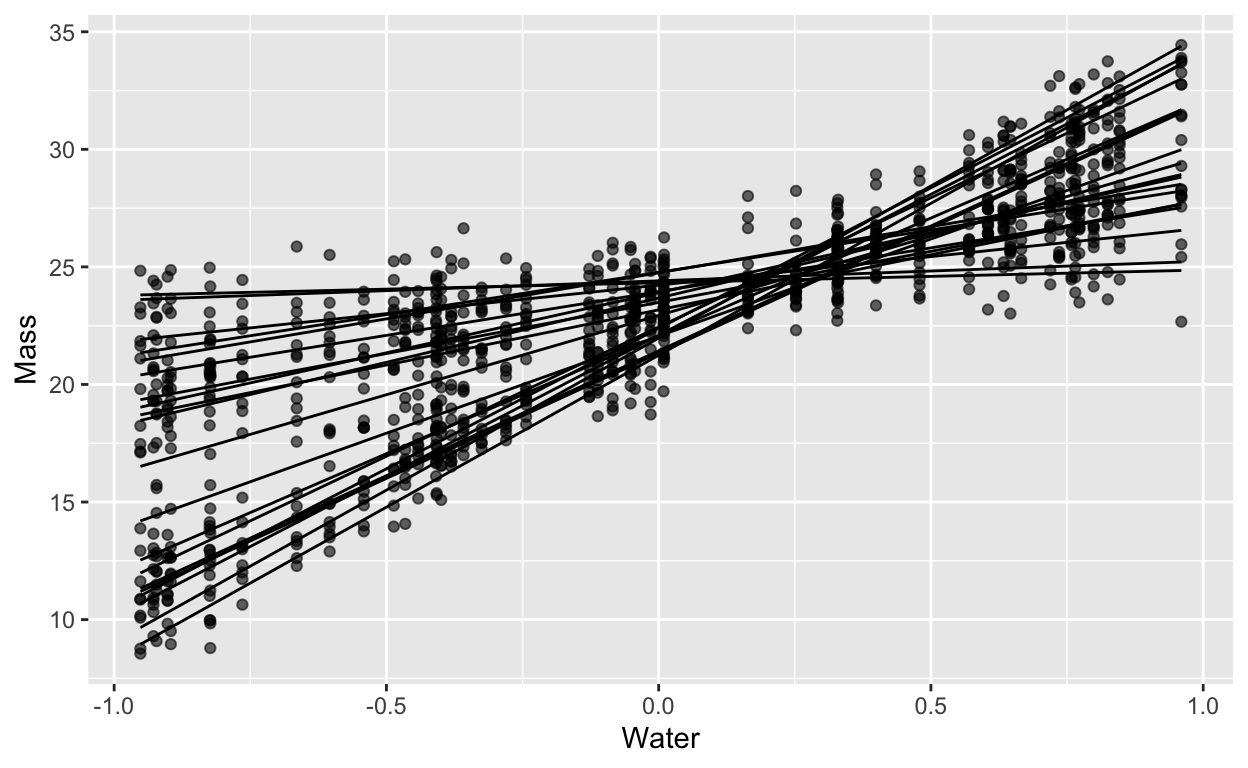
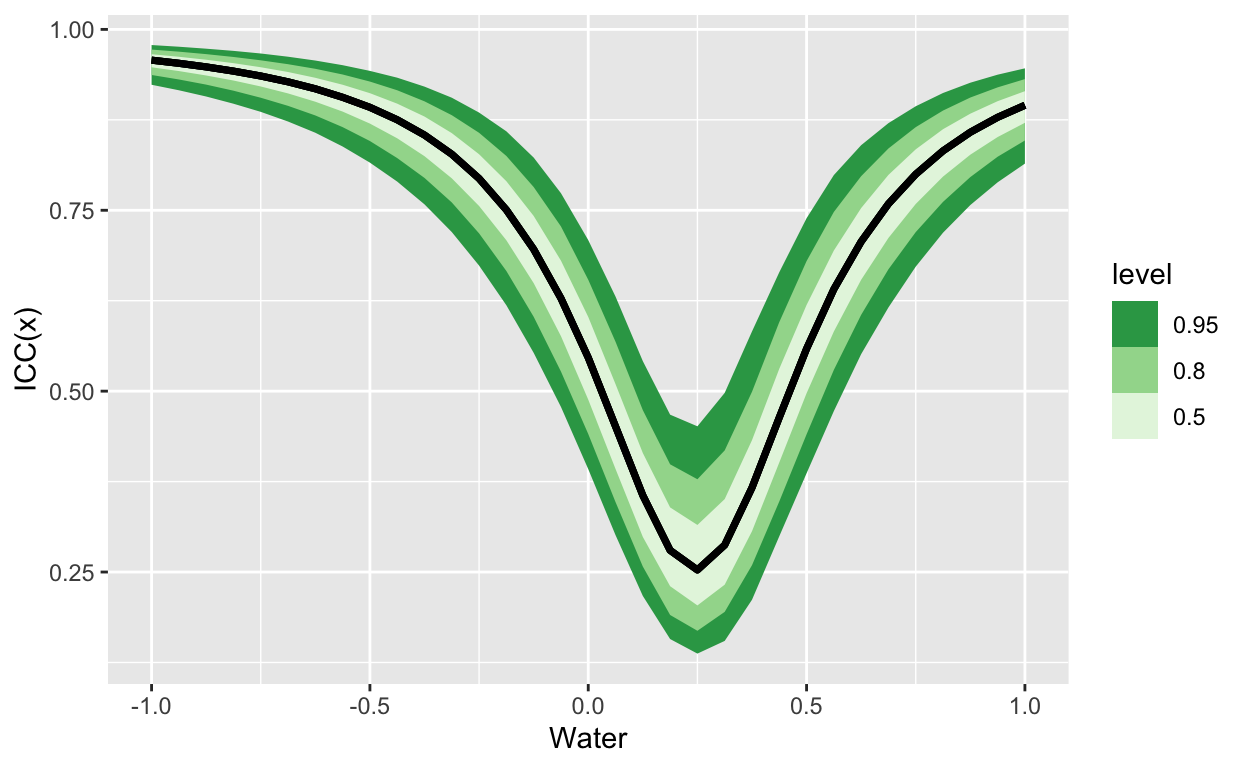
here’s a random slopes model:
For which the ICC looks like this:
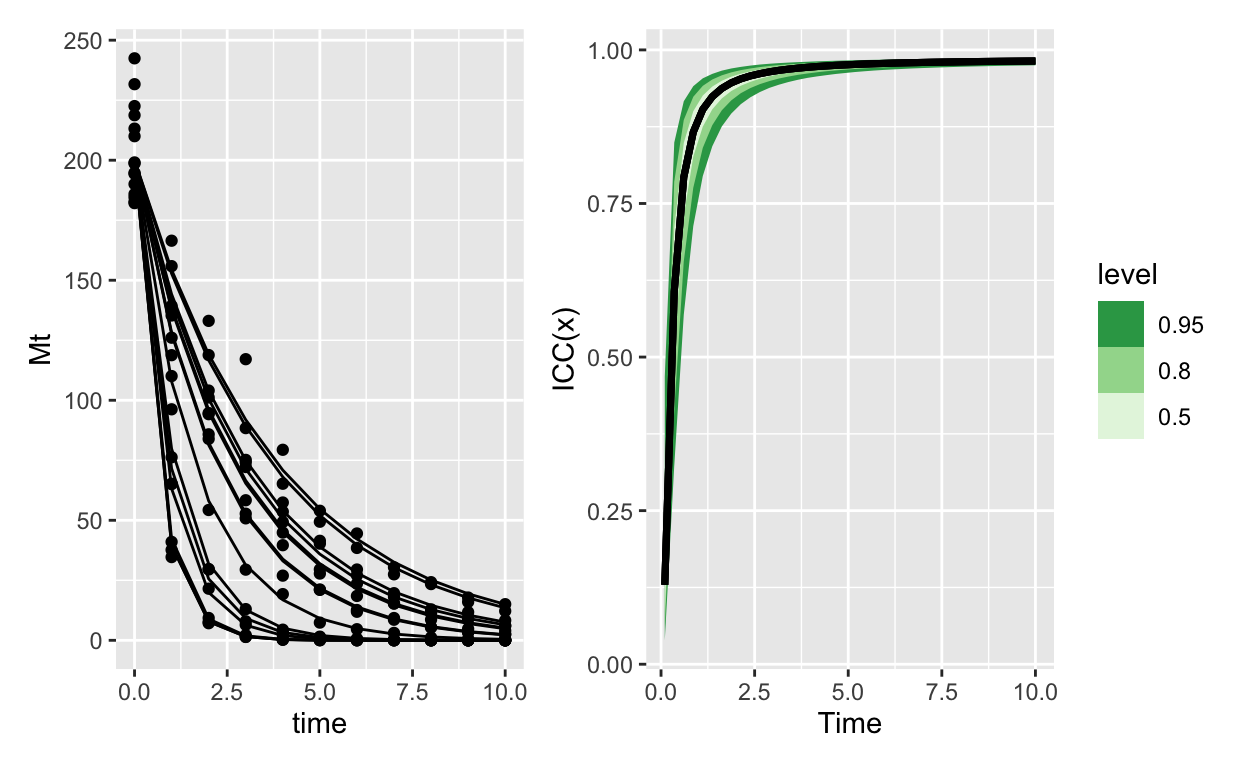
Here’s exponential decay with normal errors:
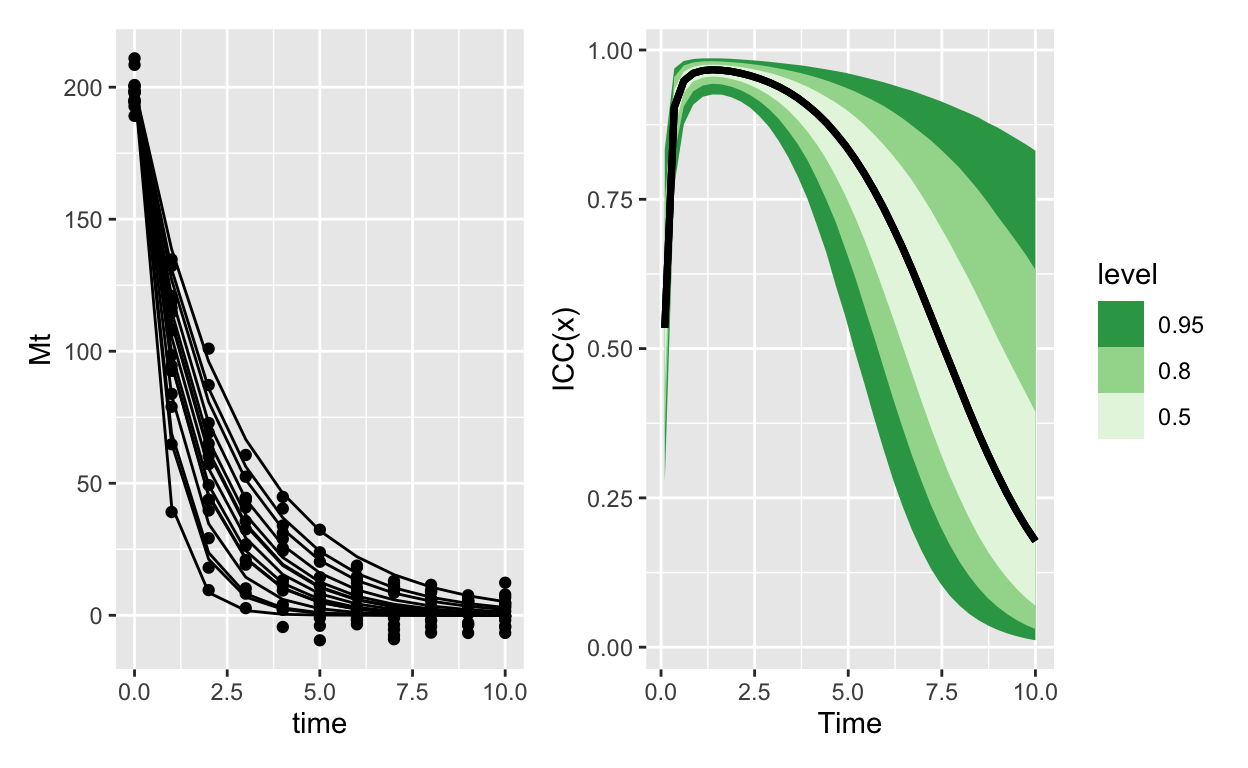
Which contrasts really sharply with the same model, except using Gamma errors:
I could say more, but I’ll instead leave space for discussion! Again all the code to generate these figures is on that (longish) github page; feel free to comment here or there, open issues etc. Thank you!