I am trying to understand mixture models for longitudinal data. An example (I think this is a growth mixture model) would be participants who are measured on some outcome over time. They eventually group into different trajectories of the outcome over time (these group memberships are not known beforehand). Thus, the data can be thought of as coming from a mixture of distributions.
I have attached the code where I simulate such data and provide a fully reproducible example. example longitudinal mixture model code.txt (1.8 KB)
Here is a plot of the data.
Running more iterations doesn’t help.
This seems like a pretty simple example… perhaps my simulated data is poor and I fundamentally misunderstand mixture models? I feel like the answer is probably something simple.
Any thoughts on why I can’t get this example to run?
I think you should try fixing the same residual standard deviation for both groups. Completely free mixtures show intrinsic degeneracies that would not be solved by any trick, I am afraid.
You can realize this in brms by specifying sigma2 = “sigma1”, I think. The information should be in the bf help page.
One solution to try would be to constrain the ordering of both intercept and slope, but you would have to dig into stan code to do this (If you find the slope declaration in brms produced code, you could just change its type to “ordered”).
The intercept and slope ordering would be better on centered-reduced (scaled) time, because I think that the intercept for both group might be quite similar, if I try to extrapolate mentally your data at time = 0. Brms does center predictors and use a trick for the intercept, it would be necessary to understand the produced code to make good moves.
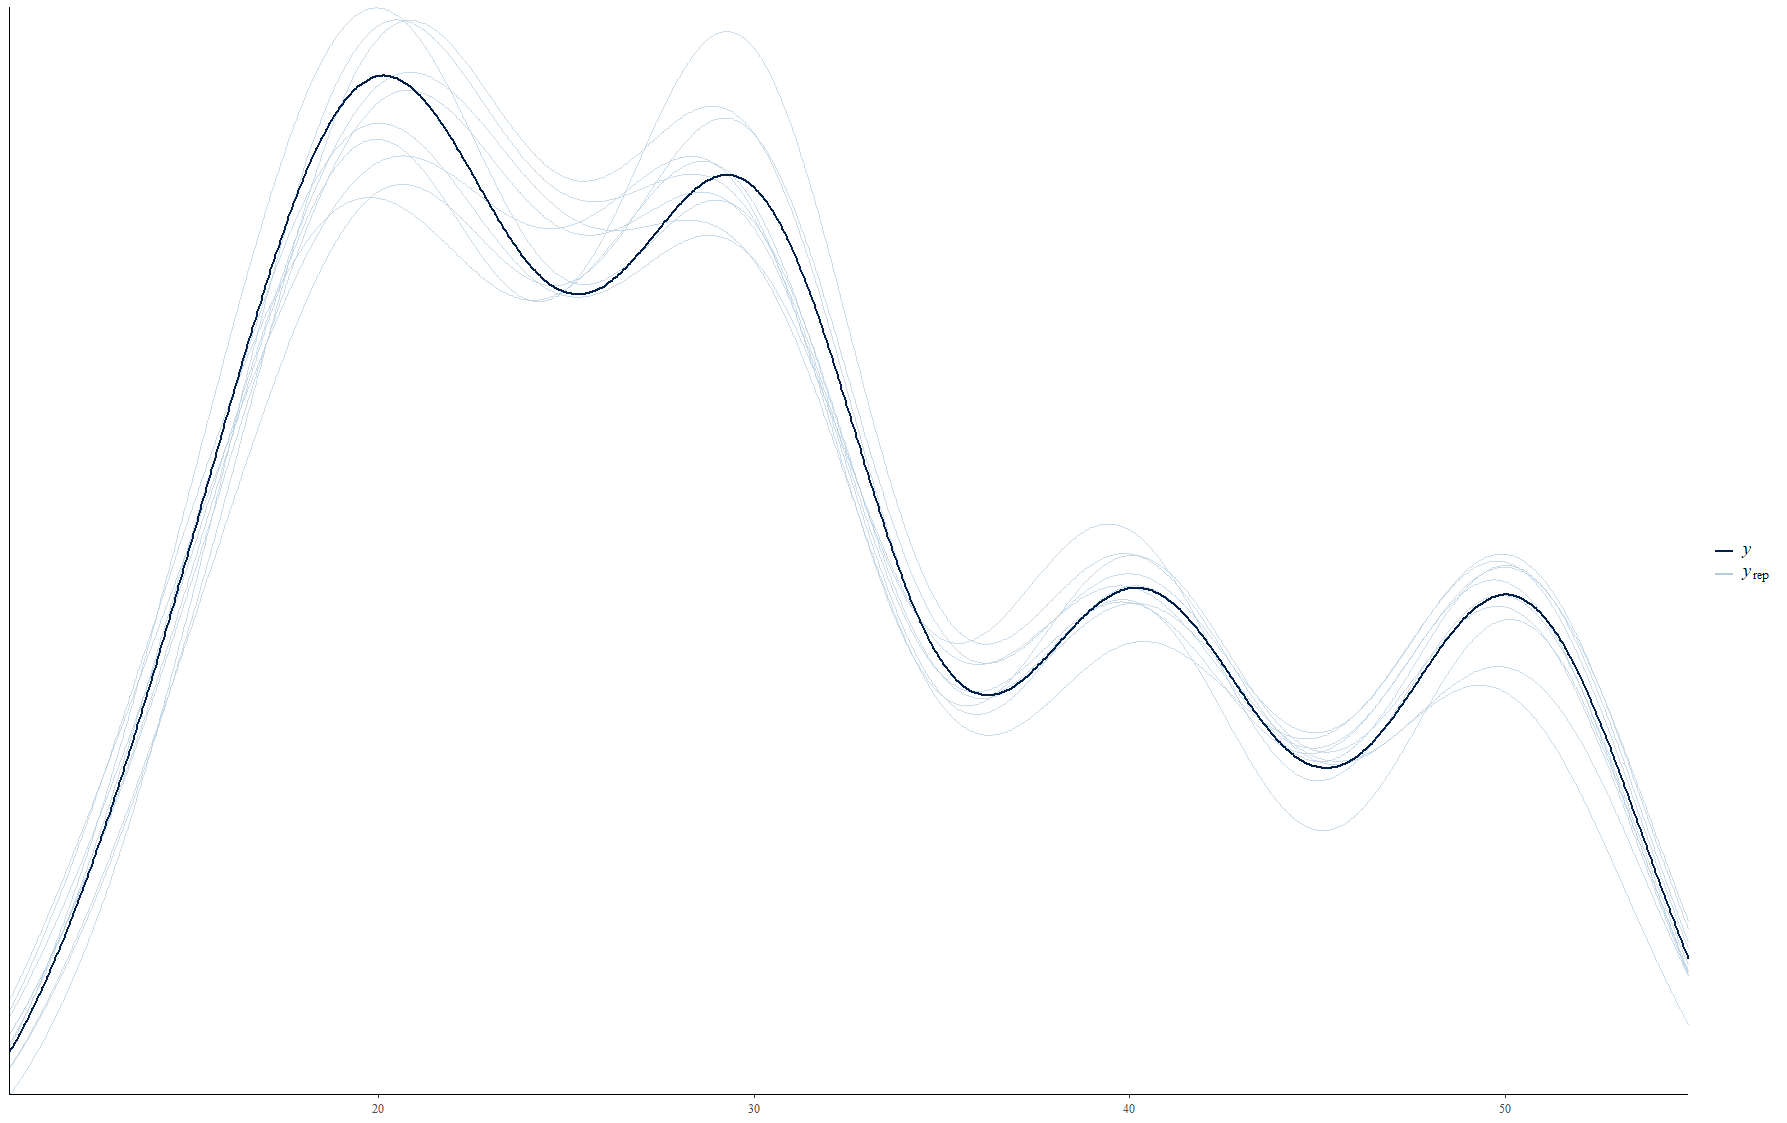
That worked! Setting sigma2 = “sigma1” did the trick. Thanks!! As you can see below, the model recovered all of my simulated parameters and the pp check looks great.
Before your response, I was playing around with the priors and made them very informative to see if the model could converge and I could recover the parameters. That didn’t help. But, oddly enough, when I set sigma2 = “sigma1” and used the very informative priors, that didn’t work either. Only when I set sigma2 = “sigma1” and went back to the less informative priors I used in the simulation code above, did it work. Any idea why that would be?? I would have thought more informative priors would have helped…
Also, I am calling this a growth mixture model. That is the correct terminology for this type of mixture model on longitudinal data, correct? (I haven’t used these models before and am trying to learn about them).
Well, shoot. Since I thought it was weird that the sigma2=“sigma1” option worked on a model with less informative priors but not on a model with more informative priors, I decided to run the same model that worked above, again. This time it didn’t run…same priors, same data, same model…how is that??
So maybe using sigma2=“sigma1” doesn’t actually work…maybe I got lucky.
I ran it a third time, and it worked…I don’t get this. How is it that sometimes it can work beautifully and sometimes fail miserably. Same data, same priors, same model…
Updated code here example growth mixture model code.txt (1.3 KB)
I’m guessing it’s a label-switching problem.
You have two distinct groups, a fast growing group and a slow growing group. In the model these are called group 1 and group 2. But these labels are arbitrary, so which is which? Does 1 mean the slow and 2 the fast one, or vice versa? BRMS tries to set the labels so that group 1 has lower intercept than group 2 but the intercepts are don’t differ much between the groups so Stan ends up making the choice at random, and each of the four chains is independent. If all four chains happen to agree on the labels then it works just fine; but if the chains disagree then the parameter estimates mix both groups together and the diagnostics will warn you that the chains are not sampling from the same posterior distribution.
Hmmm…maybe I don’t quite understand what you are saying, but I made the 2 groups different sizes. Every time I have run the model successfully (it does run more times successfully than it fails; so far 1 failure and 3 successes), mu2 is the faster growing and larger group (theta2). I have yet to see the faster growing larger group as mu1. Is that what you mean?
It would be good to have a look at traceplots to see degeneracies. If there is a label switching problem, we should see some chains for slopes going around 5 while others would go around 10, for the same mu.
As can be seen below, that doesn’t happen for the model that works…unfortunately I didn’t save the same model that didn’t converge. I will run it again a few times and see if I can get one that fails, so that I can look at the traceplots.
Was this using the latest code that I posted? I am now having trouble getting it to fail again…so far has just failed once since I started using the sigma2=sigma1
Yes, I downloaded the example growth mixture model code.txt and ran it three times.
Also, I have no idea how to use ggplot2, the same data as a histogram
Anyway, looks like two chains on the middle spike which is presumably the correct posterior, one chain on the right-hand side spike, which may be a label-switched version of the middle one, and last chain decided that all data comes from group 2, \theta_1\approx 0.
Interesting. Thanks!
I am not sure what to make of all of this…it seems to work most of the time and then occasionally fail miserably. Perhaps label switching is part of that.
The ggplot2 code was simply to recreate the plot in the original post.
I’m hoping that the real data I have coming will be easier than my own simulation…but I’m not banking on that haha!
I have been thinking about the varying intercept part and it is quite difficult for me to understand their role because each individual should belong to one group or another!
Imagine the mean of an individual from group 2 being modeled in the mean equation of group 1: what would it mean? I am not able to formulate my intuition correctly, but I kind of feel that the ID specific intercepts lead to a strangely formulate model, where inter-individual variation among individuals of a group is modeled around the mean of another group…
oohh… good point. I was just thinking they would be offsets from the mean of the distribution that they fell into. For what it’s worth, I did try without group-level effects (before trying your sigma2=“sigma1” suggestion) and the model still failed.
Right now it seems to work most of the time…but I am not sure about your question about varying intercepts. @paul.buerkner for the mixture models (as in my code above), are the varying intercepts offsets from the intercept of each distribution that they fall into?
Unless otherwise specified (over bf(mu1 ~ ..., mu2 ~ ...)) than we have random intercepts for all components. Note that we don’t have a mixture model for ID but just of the outcome distribution and brms doesn’t support anything else mixture-wise at this point.
OK, I see that now, if I do ranef(m1) then there are 90 random intercepts for mu1 and 90 for mu2.
I guess it doesn’t matter so much, since the intercepts were programmed the same for this sim, but that would be a special case.
I guess I am not sure how to implement a mixture model for longitudinal data (growth mixture model), then. It seems that you need to account for the correlation of multiple data points per ID, but it doesn’t make sense to have varying intercepts or slopes for every ID for each distribution, right? Looks like it should just be for the distribution that the ID’s fall into.
I haven’t found a good example for a growth mixture model in brms, but if anyone knows, that would be helpful.
I went ahead and marked the solution as specifying sigma2=“sigma1” because that (mostly) solves the problem in the original post.
If anyone has thoughts on this example of a growth mixture model or has a better example of implementing a growth mixture model in brms as described in the original post, please chime in.