I’m running a hierarchical multinomial logit model on discrete choice survey data, and seeing this message I’ve never seen before: “The ESS has been capped to avoid unstable estimates.” I see that this warning message in discussed in this github issue: Constant value returned by ess_basic in case of antithetic sampling without warning · Issue #211 · stan-dev/posterior · GitHub .
Is this something I should be concerned about? I haven’t encountered this message when running other data sets with the same Stan model. One unusual aspect of this data set I’ve noted is that the mean vector for the upper-level model (population mean for the hierarchical prior) has values that are all close to zero, with a posterior SD around 0.017. Makes me wonder if my data are scrambled somehow.
Not necessarily, but I need a bit more information. This usually happens when the chain is super antithetic (odd lags have strong negative correlation) and the chain is quite short. While the antitheticity is usually good for central quantities, it can indicate that the tail quantities will have very low ESS. How long chains are you using? Can you Bulk-ESS and Tail-ESS? Can you show a trace plot for the chain(s)?
I’m running a single chain, and I have seen this “ESS capped” message when doing 200+200, 400+400, and 800+800 iterations (warmup+sampling). The message occurs when computing bulk ESS for the lower level of the hierarchical model (per-group coefficient vectors beta[ , g]).
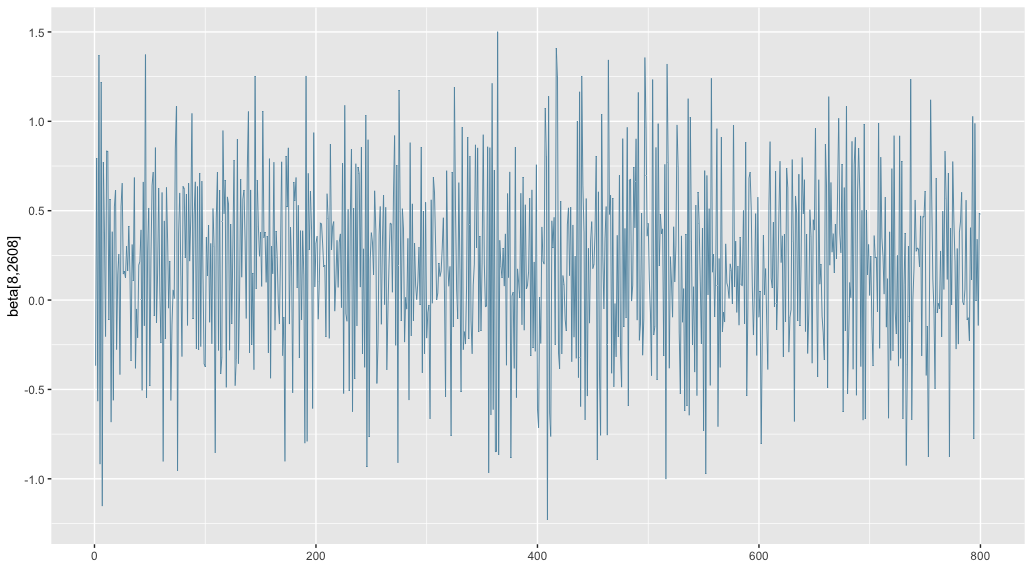
For the 800+800 run, 969 of the 16 * 2939 coefficients have this capped bulk ESS, equal to 2322.47 (== 800 * log10(800)). The tail ESS ranges from 295.5 to 824.9 for these variables. Here’s a trace plot for one of them:
I don’t know if this is relevant, but one of the model parameters is the Cholesky factor of a covariance matrix that defines a multivariate normal distribution over the columns of beta, and its elements have low ESS (below 100, some as low as 30).
Looking at the trace plot, it’s good that it’s not visibly sticking. The chains you run are quite short, and in this case the antitheticity seems to be harmful for overall mixing. Depending on your needs of accuracy (e.g. less accuracy needed in early exploration of models [2011.01808] Bayesian Workflow), this might be fine. For better accuracy and diagnostics you need to run longer chains or more chains. You might get better behavior with better mass matrix (e.g. just with longer warmup). There might also ways to improve the posterior geometry by changing the parameterisation, and if you post the model, someone in the forum might have ideas.
Also if the data are available or you can create simulated data that would produce similar behavior I would be interested to make additional experiments with some adaptation and NUTS variants.
Not saying I’d recommend this, but another way to potentially break the antitheticity might be to look up the commonest treedepth you’re getting and set the max treedepth to be one lower (and then optionally run twice as many iterations in a similar wall time).
I thought suggesting this, and it’s not a terrible idea. We’re looking for a better way to how to reduce problems of high negative autocorrelations, but need to run more experiments.
Thanks, @avehtari. I’ve gotten permission to share the data with you. I don’t want to post it on a public forum, so could you contact me at kevin@bayesium.com, and I’ll tell you how to access it? Of course, I’ll pass on the model code, too.