Hi all! I would love some help to understand what is going on with my model and if it’s a known problem.
I simulated data to understand what drive tree ring width. Here’s a basic version of the model:
ypred ~ normal(mu, sigma)
mu = a + asp + atreeid
a ~ normal (0, sigma2)
asp ~ normal(0, sigma3)
asite ~ normal (0, sigma4)
atreeid ~ normal(0, sigma5)
Here’s the stan program:
data{
int<lower=0> N;
int<lower=0> Nspp;
array[N] int species;
int<lower=0> Nsite;
array[N] int site;
int<lower=0> Ntreeid;
array[N] int treeid;
array[N] real y;
}

parameters{
real a;
real<lower=0> sigma_asp;
real<lower=0> sigma_asite;
real<lower=0> sigma_atreeid;
real<lower=0> sigma_y;
vector[Nspp] zasp;
vector[Nsite] asite;
vector[Ntreeid] atreeid;
}

transformed parameters{
vector[Nspp] asp;
asp = 0 + sigma_asp*zasp;
array[N] real ypred;
for (i in 1:N){
    ypred[i]=
        a +
        asp[species[i]] +
        asite[site[i]] +
        atreeid[treeid[i]];
    }
}

model{
  asite ~ normal(0, sigma_asite);
  atreeid ~ normal(0, sigma_atreeid);
  a ~ normal(1.5, 1);
  sigma_asp ~ normal(0, 0.3);
  zasp ~ normal(0, 1);
  sigma_asite ~ normal(0, 1);
  sigma_atreeid ~ normal(0, 0.1);
  sigma_y ~ normal(0, 1);
  y ~ normal(ypred, sigma_y);
}
Code to produce fake data
set.seed(124)
a <- 1.5
sigma_y <- 0.1
sigma_a_spp <- 0.5
sigma_a_treeid <- 0.15
sigma_a_site <- 0.3

n_site <- 10 # number of sites
n_spp <- 10 # number of species
n_perspp <- 5 # number of individuals per species
n_treeid <- n_perspp * n_spp * n_site # number of treeid
n_meas <- 3 # repeated measurements per id
N <- n_treeid * n_meas # total number of measurements
N

# get replicated treeid
treeid <- rep(1:n_treeid, each = n_meas)
# non replicated treeid
treeidnonrep <- rep(rep(1:n_perspp, times = n_spp), times = n_site)
# replicated spp
spp <- rep(rep(rep(1:n_spp, each = n_perspp), times = n_site), each = n_meas)
# non replicated spp
spp_nonrep <- rep(rep(1:n_spp, each = n_perspp), each = n_site)
# replicated site
site <- rep(rep(rep(1:n_site, each = n_spp), each = n_perspp), each = n_meas)
# non replicated site
site_nonrep <- rep(rep(1:n_site, each = n_spp), each = n_perspp)
# quick check
table(treeidnonrep, site_nonrep)

simcoef <- data.frame(
  site = site,
  spp = spp,
  treeid = treeid
)

# get intercept values for each species
a_spp <- rnorm(n_spp, 0, sigma_a_spp)
a_site <- rnorm(n_site, 0, sigma_a_site)
a_treeid <- rnorm(n_treeid, 0, sigma_a_treeid)

# Add my parameters to the df
simcoef$a_treeid <- a_treeid[treeid]
simcoef$a_site <- a_site[simcoef$site]
simcoef$a_spp <- a_spp[simcoef$spp]

simcoef$a <- a
simcoef$sigma_y <- sigma_y
simcoef$sigma_a_treeid <- sigma_a_treeid
simcoef$sigma_a_spp <- sigma_a_spp
simcoef$sigma_a_site <- sigma_a_site
simcoef$error <- rnorm(N, 0, sigma_y)

# sum for tree rings
simcoef$ringwidth <-
  simcoef$a_site +
  simcoef$a_spp +
  simcoef$a_treeid +
  simcoef$a +
  simcoef$error

# prepare grouping factors
simcoef$site <- factor(simcoef$site)
simcoef$spp <- factor(simcoef$spp)
simcoef$treeid <- factor(simcoef$treeid)

# scale up a and b
simcoef$ringwidth <-
  simcoef$a_site +
  simcoef$a_spp +
  simcoef$a_treeid +
  simcoef$a +
  simcoef$error
Parameter recovery
Below I show on the y axis how my model is returning my parameter values and on the x axis, it’s the parameter values I fit.
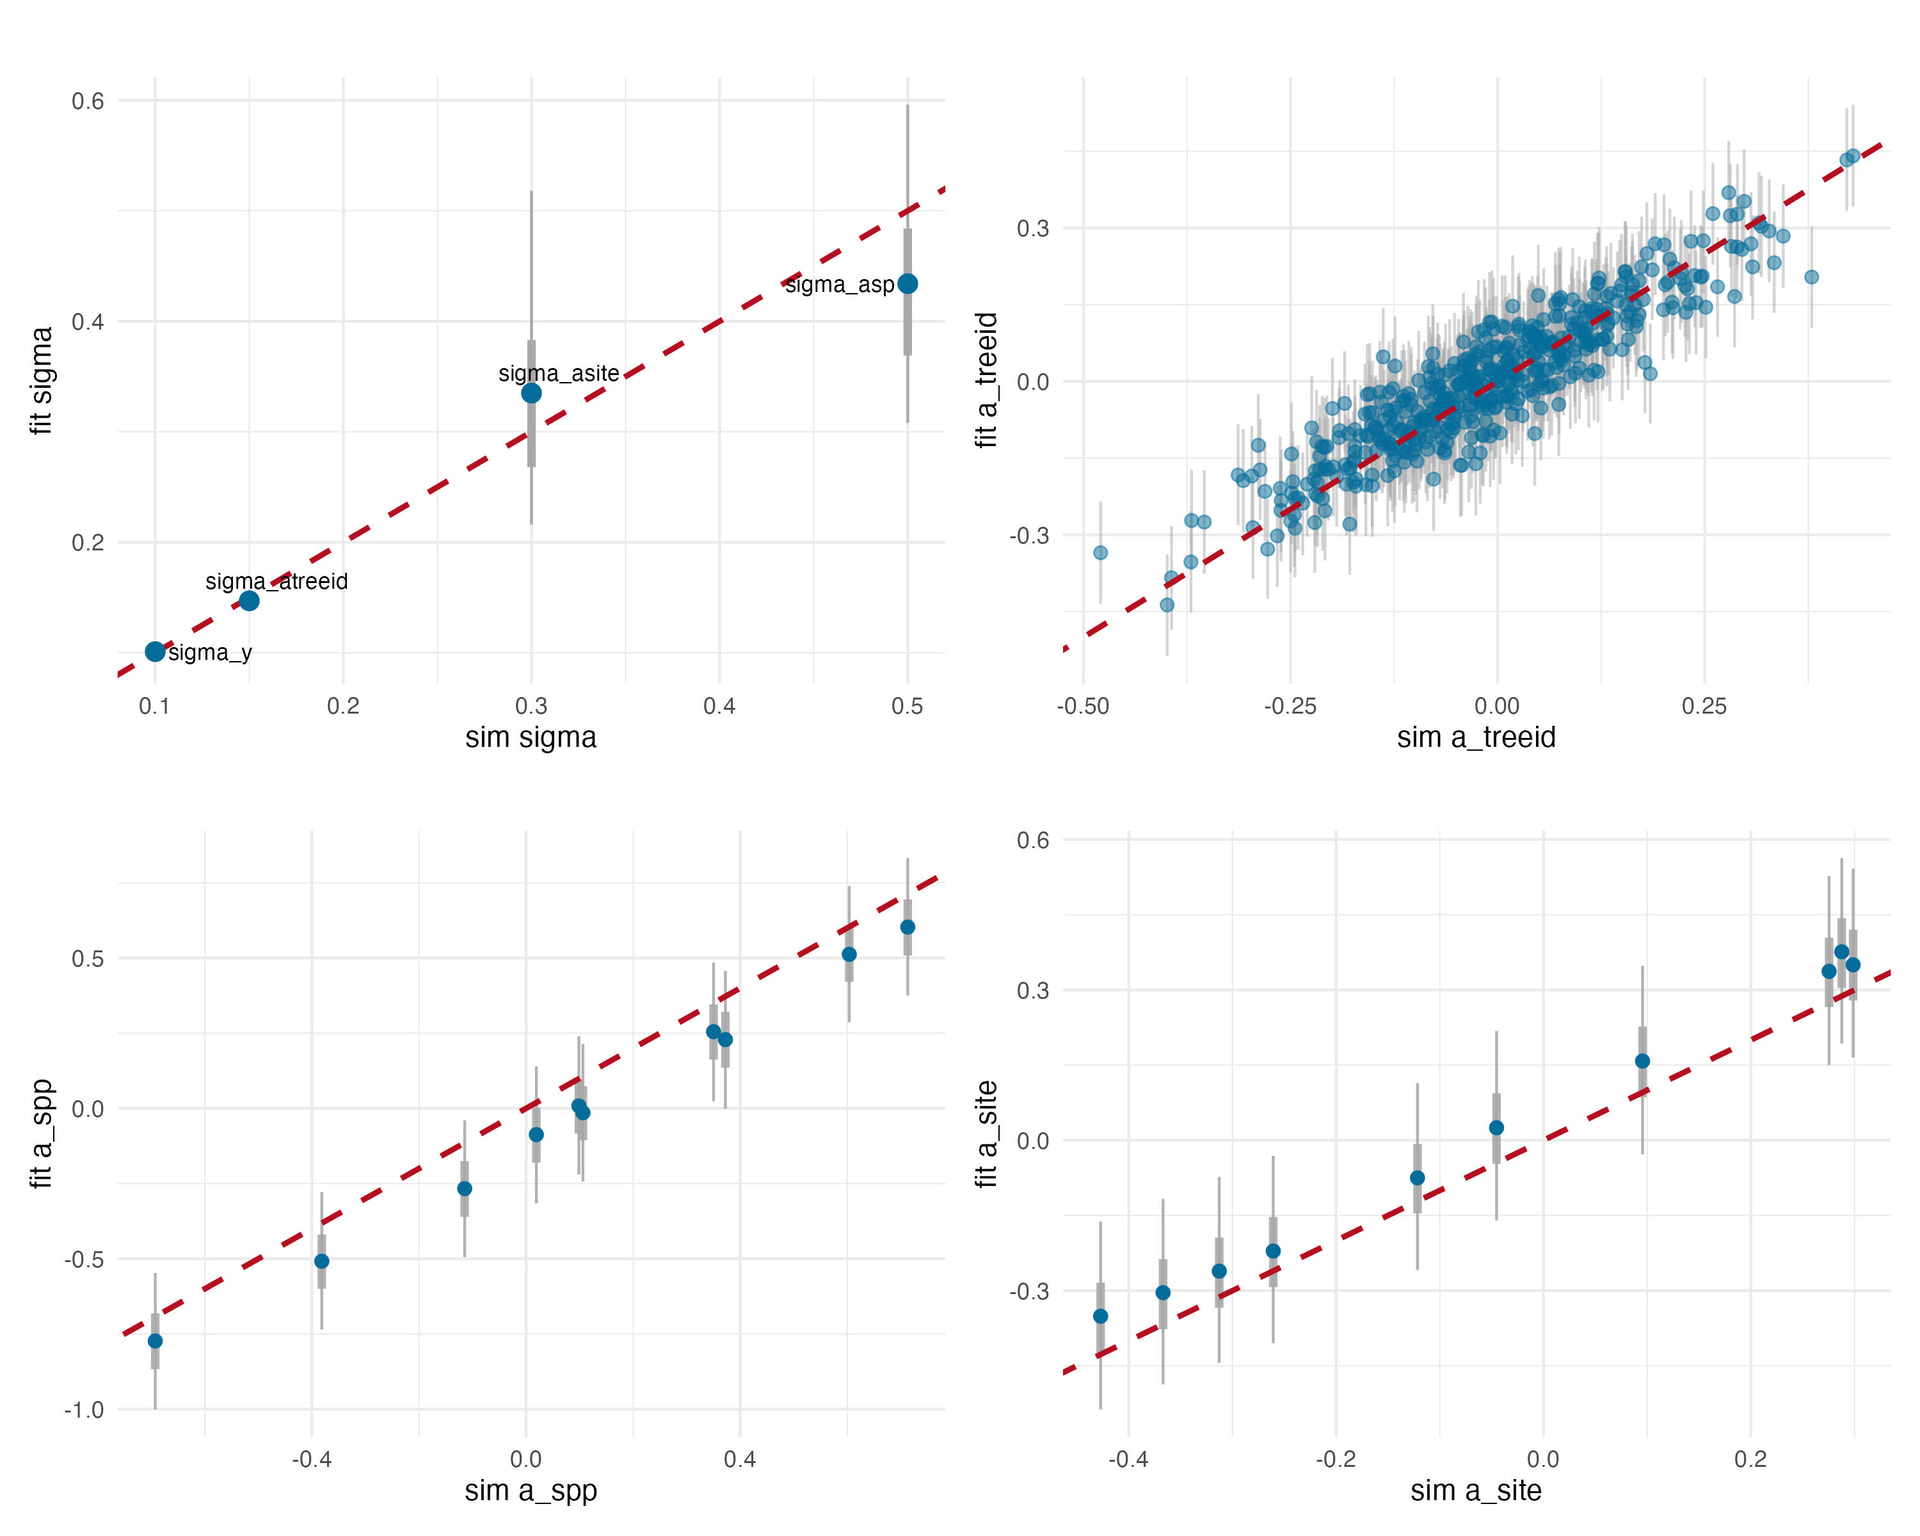
My question:
Why is the model underestimating a_spp and overestimating a_site so consistently? This is very weird to me and I’ve been struggling for weeks to figure out why. Is it a known problem? How could I solve it?
My interpretation is that the relative deviation from the overall intercept (a) is proportionally to big compared to the overall intercept value (here 1.5). I though increasing the value of a to something bigger to decrease the relative importance of the other paramaters would help, but it didn’t make a huge difference.