Comparing residual variation across models

Hi!

I’m not sure how much background information I should provide as I’m new to this forum (and, as I’m sure is evident from the text below, fairly new to brms). I hope the below is sufficient!

I’ve been running several models and have been doing an extensive comparison with WAIC and WAIC weights to ‘select’ the best model. The dependent variable is a linguistic variable (just binary: A or B), and the effect of age and determiner preceding the variant is assessed, with ‘individual’ as a group-level effect:

ing ~ det + age_sd + (det*age_sd|author) #M1

Another model of interest includes the effect of ‘isolation’ (whether or not an individual has spend time in isolation):

ing ~ det + age_sd + isolation + (det*age_sd|author) #M2

Inclusion of ‘isolation’ does not improve the fit (in fact, it increases the WAIC slightly and weights are in favour of the simpler model), but it does bring about a decrease in the sd(Intercept) of the Group-level effect author.

I’m trying to keep this short, so my question is: if you compare these models, can you conclude that M1 has more residual (author) variation than M2?
If so, what would be good practice wrt comparing them?

I’m also happy to hear tips for better techniques to implement this question! I’m not so much convinced that spending time in isolation affects the dependent variable, but I do think it helps reduce estimated variance in age slopes – if that makes sense?

Thanks in advance!
1 Like

Hi, this is very relevant question and I think you formulated it well.
There is a recent papers on variance partitioning https://www.biorxiv.org/content/10.1101/2021.10.17.464682v1 that might give you some additional ideas.

waic is unreliable for hierarchical models, and I recommend to use PSIS-LOO instead as it has better diagnostics when it’s failing

There is possibility that two terms are explaining similar information and are thus correlating and then adding a correlating component can increase the predictive performance only a little. In such case you should look also about the correlation between the isolation effect and the magnitude of the group effect.

If my answer is not clear, please ask again, and if you make, e.g. pairs plots showing the dependency between the effects, please share here, so we can continue discussing what kind of workflow would be good to find the answer to this type of question.

2 Likes

Hi Aki!

Thanks so much for your input (and for the interesting paper on variance partitioning).

I was just reading your papers on psis-loo and waic when you wrote back! Meanwhile, I’ve redone everything with ‘loo’ rather than ‘waic’ as criterion, and the overall outcome (estimates, deviation, weighst, etc.) is comparable.

I’ve tried to generate a pairs plot with pairs() on the fitted model, but R seems unable to render it and unfortunately I’ve not been able to resolve that yet… Is there a simpler way to gain some insight into effect dependency?

I do feel like I should take a step back and add the following:
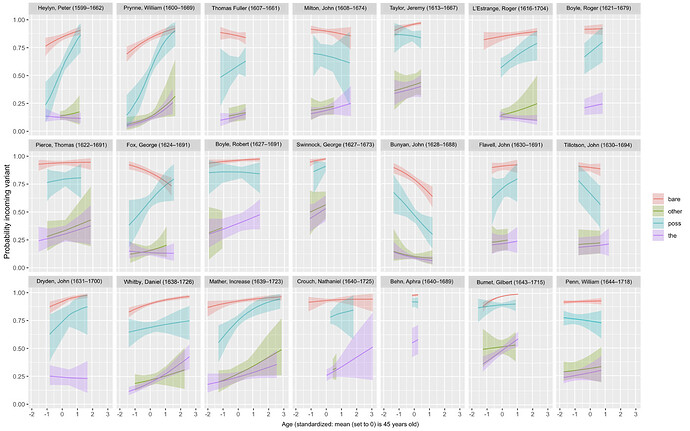
My data is based on the output of 21 authors, who use variant A (0) or B (1) to differing extents across their productive careers, with B becoming the dominant option over time in the grammatical contexts represented in red and blue. Overall, I have 16,226 datapoints, with the lowest number of point per author being around 210. As can be expected from what we know about language change, the majority of detectable age effects are in the direction of the population-level trend. There are, however, two authors for whom the slope of the red line is downward rather than upward. These are the plots for ing ~ det + age_sd + (det*age_sd|author) with the CI set to c[0.05,0.95]:

Trying to understand these differences, one could suggest that there is a subgroup of authors (e.g. those that have spent long periods in isolation), and these authors do not fit the value of the random effect estimated for the other authors in the sample. Hence, one could say, there is a missing variable (e.g. ‘isolation’) that explains differences in age slopes.

My first problem is perhaps that I’m not sure how to model this, and I wonder if what I’m dealing with is comparable to this issue resolved by @paul.buerkner, in that I want to consider whether different groups of authors may vary in terms of the author slope variance that they introduce.

That said: whatever I try, I end up with minuscule looic differences and relatively evenly distributed weights (which are ultimately in favour of the least complex model). I’m happy to conclude that it is unclear whether ‘isolation’ improves the predictive power of the model and that this warrants further analysis, but before doing so I’d like to make sure I model it appropriately, and that I’m looking in the right place to see whether it can at all help explain the observed author variance.

Thank you so much again for thinking along!

How about mcmc_pairs()?

But here the isolation is just affecting the intercept and not age slope? Should this be something like?

ing ~ det + age_sd + (age_sd|isolation) + (det*age_sd|author) #M2

If you have many observations for each author, it is also possible that the hierarchical model part is not affecting much as the author specific age_sd coefficients can be determined well from the data. Leave-one-author-out could be more sensitive measure. That is, if you leave out all observations for an author, how well you can predict the behavior of that author given isolation. Instead of raw data you could also make a model predicting those slope values (summarised as mean and sd, as is done in the famous 8 schools example).