Hello,
I am working on a gaussian process model with a correlation matrix on both the intercept and slope. The model was developed using test data and has undergone several iterations to improve its efficiency (see my previous post on this model here).
The full model now runs, but it does take several days given I have a large dataset. In running it on my real data, the model was returning values similar to those estimated using simpler models in which I included the correlation matrix only on the intercept, or only on the slope. However, the full model was still producing four divergent transitions. Most of the output looked good, except for the lambdaintercept_b parameter, which has a beta distribution.
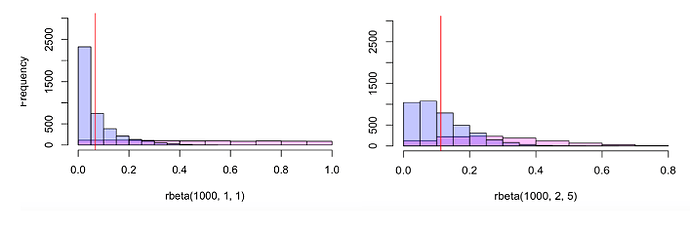
To remove the divergent transitions, I tried changing the prior on lambdaintercept_b from a flat prior of (1,1) to a more skewed prior of (2,5). In the figure below, the prior is shown in pink, the posterior in blue, and the mean estimate in red. The figure on the left is comparing the prior distribution from my original model with a prior of (1,1) for the beta distribution of lambdaintercept_b, and the figure on the right the model with a prior or (2,5).
The model with the new prior no longer produced any divergent transitions, but I was surprised to find that the estimate for this parameter almost doubled, from 0.067 to 0.113.
While the change to the prior of this parameter did fix the remaining divergent transitions, I am concerned that it might be having a strong effect of the parameter estimates.
Any insight into whether this is likely the case and something I should be concerned about would be appreciated. I am happy to provide any additional information needed.
Thanks,
Deirdre

