Is there an easy way to extract an appropriate number for the parameters used in a brms fit?
1 Like
I see. Then is there a function or a procedure that I can follow by myself to get the number of parameters that can be used to compare with p_loo?
Thank you so much for this detailed answer and all the references! I am not very familiar with the concept of Pareto smooth sampling and related concepts that are involved in loo() but I will take a look at the materials you suggested and follow your suggestions to check my models. Thanks a lot!
1 Like
Two quick questions regarding the interpretation of high Pareto k estimates:
- If posterior predictive check looks good, then can this be used as an evidence to say that the model is not misspecified?
- High Pareto k could be due to model is so flexible or the population prior so weak. If that is the case, is this something to worry about or it is good to leave the model as it is and use it?
Only as a partial evidence, as it’s possible that 1) model is overfitting, 2) posterior predictive check is misleading, e.g. 2a) if kernel density estimate is used it can hide problems, or 2b) looking at the marginal doesn’t reveal problems with conditional distributions.
It depends. If you have a simpler equivalent model maybe use that instead (e.g. models where the latent values can be integrated out analytically). If you know you model is likely to be the best one then do enough other checks or do K-fold-CV etc.
1 Like
Got it. Thank you for your answer!
1 Like
Greetings,
Rather than opening a new topic, I would like to revive this one and ask about the reliability of LOO-PSIS for categorical(multinomial) models with discrete data.
I am not comparing the two models, yet I want to check model performance. Here are my results from arviz.loo, How should I proceed? Should I apply reloo (which is still in experimental stage in Arviz) ?
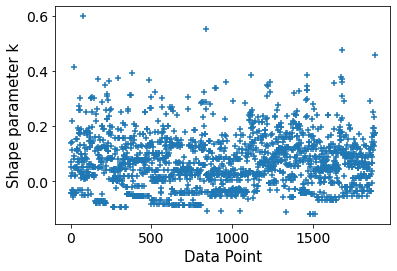
UserWarning: Estimated shape parameter of Pareto distribution is greater than 0.7 for one or more samples. You should consider using a more robust model, this is because importance sampling is less likely to work well if the marginal posterior and LOO posterior are very different. This is more likely to happen with a non-robust model and highly influential observations.
  "Estimated shape parameter of Pareto distribution is greater than 0.7 for "
Computed from 40000 posterior samples and 1887 observations log-likelihood matrix.

         Estimate       SE
elpd_loo -1086.05    41.25
p_loo      158.86        -

There has been a warning during the calculation. Please check the results.
------

Pareto k diagnostic values:
                         Count   Pct.
(-Inf, 0.5]   (good)     1804   95.6%
 (0.5, 0.7]   (ok)         56    3.0%
   (0.7, 1]   (bad)        20    1.1%
   (1, Inf)   (very bad)    7    0.4%
One final question, How do you report these results in a paper?
p_loo seems high, but as you don’t tell the number of parameters in the model, I’m not able to provide guidance as discussed in my post.
It would be useful to test it
What is purpose of the model and analysis? Maybe it would be useful to use an application specific utility/loss that the audience is used to interpret?
1 Like
My model as follows;
model = bmb.Model("Modal~ Subject_Pos + Animacy + Pattern + Modal_C + Verb_C + Voice + Aspect + Topic_C ", data = df, family = "categorical")
Also summary output;
az.summary(idata)
                       mean     sd  hdi_3%  ...  ess_bulk  ess_tail  r_hat
Intercept[could]     -5.111  1.748  -8.481  ...   40076.0   27586.0    1.0
Intercept[may]       -4.876  1.751  -8.192  ...   43095.0   29569.0    1.0
Intercept[might]     -9.392  2.021 -13.268  ...   35466.0   29329.0    1.0
Intercept[must]      -4.498  1.260  -6.884  ...   35056.0   31421.0    1.0
Intercept[shall]    -13.775  2.605 -18.753  ...   30023.0   31057.0    1.0
                    ...    ...     ...  ...       ...       ...    ...
Topic_C[T9, must]     1.002  2.892  -4.602  ...   20178.0   26130.0    1.0
Topic_C[T9, shall]   -5.253  5.952 -17.040  ...   43337.0   31879.0    1.0
Topic_C[T9, should]  -0.823  2.912  -6.241  ...   20180.0   27113.0    1.0
Topic_C[T9, will]     2.605  3.459  -3.891  ...   32170.0   32606.0    1.0
Topic_C[T9, would]    2.481  3.469  -3.927  ...   32004.0   31729.0    1.0

[232 rows x 9 columns]
Well, I do not think there is a common utility/loss application the audience is used to. The only thing asked for is R2 score which is unavailable in Arviz expect for Linear Regression.
The number of parameters is 232 including intercept, if I am not interpreting wrong. I am not sure if there is another statistics provided with Arviz’s InferenceData. If I am wrong, can you please clarify the term ‘number of parameters’?
Well, basically I am trying to observe preference for items in the response variable given predictors. The question is how well the model works?
I assume also 232 based on 232 rows, but I’m not ArviZ user myself (just helping to get good algorithms and co there)
So that would the number of parameters? Then p_loo of about 159 is high, and your model is very flexible. reloo should work fine (given the experimental code doesn’t have bugs).
R2 for categorical is very rare.
Maybe show a confusion matrix?
1 Like
Well, a confusion matrix seems like the only way. Actually, the problem is I study/research Second Language Acquisition/Learning, a field where statistical models are not very common except for few instances of corpus studies.
For the reloo function, I am still trying to prepare a wrapper, which is a little bit challenging.Yet I found a similar topic explaining a success case.
Meanwhile, I tried to apply different models with the same variables. Still, p_loo was high in all cases. Does the skewness of the data impact results?
I think it’s just having many parameters.
I hope you get useful results with your statistical model.
I now also noticed that ess’s are very high and you seem to be running 10x too many iterations, and you could save a lot of time by running less iterations
1 Like
Since I am running on Colab, I did not bother to drop the number of iterations. Babmi with GPU support is really fast.
Cool, if the speed is not an issue, you can do full brute force LOO, which is easier to implement than reloo.
Defying proper priors seems like did the trick.
Computed from 10000 posterior samples and 1887 observations log-likelihood matrix.

         Estimate       SE
elpd_loo -1063.67    37.15
p_loo       92.08        -
------

Pareto k diagnostic values:
                         Count   Pct.
(-Inf, 0.5]   (good)     1885   99.9%
 (0.5, 0.7]   (ok)          2    0.1%
   (0.7, 1]   (bad)         0    0.0%
   (1, Inf)   (very bad)    0    0.0%
1 Like
Ah! I always forget that brms doesn’t use proper priors by default! I try to remember the next time someone asks similar question (and ask again @paul.buerkner if he would be willing to switch to default proper priors)
1 Like