# Highly variable prior predictive check. Even y is changing
**URL:** https://discourse.mc-stan.org/t/highly-variable-prior-predictive-check-even-y-is-changing/20229
**Category:** brms
**Tags:** techniques, specification
**Created:** [January 13, 2021, 9:48pm UTC](https://discourse.mc-stan.org/t/highly-variable-prior-predictive-check-even-y-is-changing/20229 "2021-01-13T21:48:44Z")
**Posts on this page:** 5
**Page:** 1
### Author:  [@JLC](https://discourse.mc-stan.org/u/JLC)
#### Post date: [January 13, 2021, 9:48pm UTC](https://discourse.mc-stan.org/t/highly-variable-prior-predictive-check-even-y-is-changing/20229/1 "2021-01-13T21:48:44Z")
I’m trying to refine a distributional model using a Student distribution for the outcome, but am seeing highly variable prior predictive checks. I have defined _y_ from the data, but even the plot of _y_ is moving all over the place.
Just wondering what I might be doing wrong with my specification.
```
fmla <- bf(y ~ 0 + Intercept +
Pred1.c +
Pred2.c +
Pred3.c +
Pred4.c +
Pred5.c +
(1|Grp1) +
(1|Grp2) +
(1|Grp3) +
(1|Grp4/Grp5),
center = TRUE,
sigma ~ 0 + (1|Grp2) + (1|Grp1),
nu ~ 0 + (1|Grp2) + (1|Grp1))
## Set priors
priors <- c(
set_prior("normal(10,5)",
class = "b",
coef = "Intercept" ),
set_prior("normal(0,1)",
class = "b"),
set_prior("normal(0,1)",
class = "sd",
coef = "Intercept",
group = "Grp3"),
set_prior("normal(1,1)",
class = "sd",
coef = "Intercept",
group = "Grp4"),
set_prior("normal(0,1)",
class = "sd",
coef = "Intercept",
group = "Grp5:Grp5"),
set_prior("normal(0,3)",
class = "sd",
coef = "Intercept",
group = Grp1"),
set_prior("normal(0,0.5)",
class = "sd",
coef = "Intercept",
group = "Grp1",
dpar = "sigma"),
set_prior("normal(0,0.5)",
class = "sd",
coef = "Intercept",
group = "Grp2",
dpar = "sigma"),
set_prior("normal(0,1/sqrt(4))",
class = "sd",
coef = "Intercept",
group = "Grp1",
dpar = "nu"),
set_prior("normal(0,1/sqrt(4))",
class = "sd",
coef = "Intercept",
group = "Grp2",
dpar = "nu")
)
Mod <- brm(
fmla,
Data,
family = student(link_nu = "logm1"),
prior = priors,
inits = 0,
iter = 5000,
warmup = 2500,
chains = 4,
cores = ncores,
sample_prior = "only",
save_pars = save_pars(all = TRUE),
control = list(max_treedepth = 14,
adapt_delta = 0.999)
)
```
With separate runs of yrep, the plot of _y_ also changes a lot.
```
y <- Data$y
yrep <- posterior_predict(Mod ,nsamples = 100)
ppc_dens_overlay(y,
yrep) +
coord_cartesian(xlim = c(-50, 50))
```
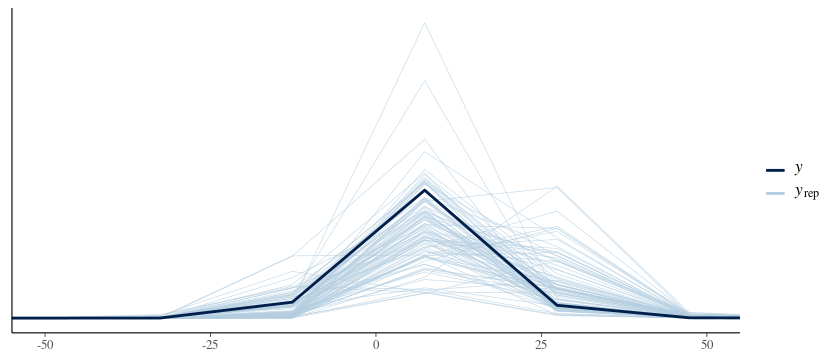  
Am I calling something incorrectly?
---
### Author:  [@torkar](https://discourse.mc-stan.org/u/torkar)
#### Post date: [January 14, 2021, 6:14am UTC](https://discourse.mc-stan.org/t/highly-variable-prior-predictive-check-even-y-is-changing/20229/2 "2021-01-14T06:14:16Z")
Try to remove the `coord_cartesian(xlim=c(-50,50))` to get a feeling for what happens. Is y count data, i.e., -n,..,-3,-2,-1,0,1,2,3,..n?
---
### Author:  [@JLC](https://discourse.mc-stan.org/u/JLC)
#### Post date: [January 14, 2021, 12:50pm UTC](https://discourse.mc-stan.org/t/highly-variable-prior-predictive-check-even-y-is-changing/20229/3 "2021-01-14T12:50:22Z")
Thanks, @torkar
_y_ is continuous and unbounded in a practical sense. I put the limits on the x-axis because the predictions are so broad that it’s difficult to see anything without the limits:

I’m curious about why the plot of _y_ would change when it’s a static vector from the data.
---
### Author:  [@torkar](https://discourse.mc-stan.org/u/torkar)
#### Post date: [January 14, 2021, 12:56pm UTC](https://discourse.mc-stan.org/t/highly-variable-prior-predictive-check-even-y-is-changing/20229/4 "2021-01-14T12:56:49Z")
Hi,
try `scale_x_continuous(trans="log")`. You have random draws from the posterior, so perhaps increase it to `nsamples=500` to get a better feel for the variability?
---
### Author:  [@JLC](https://discourse.mc-stan.org/u/JLC)
#### Post date: [January 14, 2021, 9:14pm UTC](https://discourse.mc-stan.org/t/highly-variable-prior-predictive-check-even-y-is-changing/20229/5 "2021-01-14T21:14:02Z")
Thank you! That certainly gives a better and more stable view:
 